The Databank from the Department of Public Expenditure and Reform is a useful resource. Here is a quick look at overall gross voted current expenditure broken in three categories
Pay and Pensions
Social Welfare
Non-Pay
From 1994 to 2011 gross voted current expenditure rose from €14 billion (30.0% of GDP) to €54 billion (34.3% of GDP). Here is the proportion of gross current voted expenditure that went on the three categories.
Pay and pensions as a percentage of current expenditure peaked at 41% in 1998 and had fallen to 37% by 2008. Since then social welfare expenditure has consumed an increasing proportion of current expenditure. If we look at the nominal amounts of expenditure.
We can see that all three categories are lower but the largest falls have been in non-pay current expenditure which has been falling since 2008.
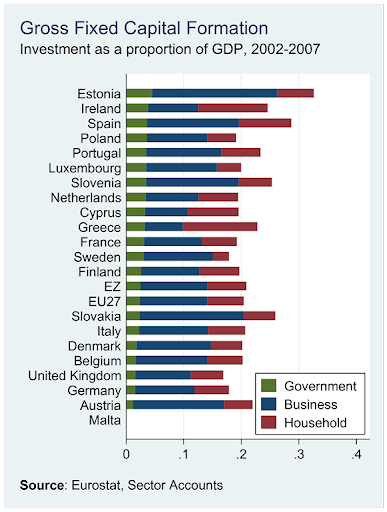
The following graphs contain details of investment of as a proportion of GDP for 20 EU members. These are the EU15 (members of the EU before the accession of Eastern European countries in 2004 and 2007), the members of the Eurozone not in the EU15 (Cyprus, Estonia, Latvia, Malta, Slovakia and Slovenia) and Poland. This gives 21 countries but as Malta has no data reported to Eurostat in the required categories the sample is 20 countries.
First, here is investment as a proportion of GDP in the chosen countries between 2002 and 2007. Ireland ranks fifth of the 20 countries shown and second in the EU15. The top six countries from the EU15 are Spain, Ireland, Portugal, Greece, Austria and Italy.
If we analyse the investment by sector of source, we get the following rankings for Ireland in the 2002-2007 period. Click the links to see graphs.
It is government and household investment that pushed Ireland up to fifth in the overall ranking (and second in the EU15). Business investment as a proportion of GDP was lower in only Greece and Cyprus. The top three countries for household investment between 2002 and 2007 were Greece, Ireland and Spain.
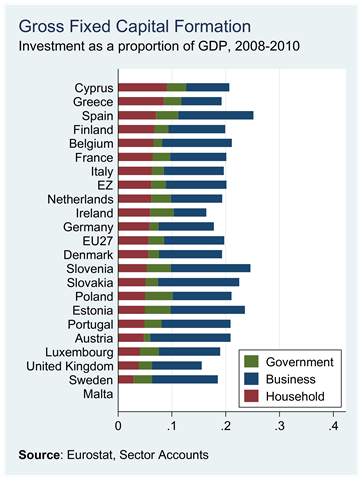
If we move t0 the period since 2007 when investment in Ireland peaked, the following picture emerges for the years 2008 to 2010. .
Ireland drops from fifth to 19th and is now flanked by Germany and the UK. This might be appropriate for a mature economy with low unemployment but that if not an description that is usefully associated with the Irish economy. The rankings by sector now are:
Ireland’s relative position fell in all three sectors with a fall of seven positions for household investment and a drop to last for business investment. Even with the cuts in the public investment since 2008, Ireland still ranked highest in the EU15 for government investment in the three years to 2010.
The IMF provide forecasts of investment up to 2016. They don’t give a breakdown by sector but we can look at the total. Ireland is last.
The average for the 20 countries above Ireland (the IMF provides forecasts for Malta) is 20.0% of GDP. For Ireland, the forecast of investment as a percentage of GDP from 2011 to 2016 is 10.5%.
The recent IMF review for Ireland (Table 2, pdf page 31) shows that they expect public investment to fall to 2% of GDP by 2013 and stay there at least up to 2016, with investment from the household and business sectors bottoming at 6.8% of GDP in 2011 and rising slowly to 9.8% of GDP by 2016.
Retail sales did rise towards the end of the year but the 3% figure for December is for the All-Business Index. This includes the Motor Trades which even in December has a significant impact on the index. The Motor Trades weighting for December is 8% (for January it is 35%).
Instead we will focus on ‘core’ retail sales which strips out the effect of the Motor Trades. Here is this index since the start of 2008.
The drops seen in 2008 and 2009 have eased but signs of a sustained recovery remain absent. Although there was an increase in retail sales towards the end of the year the ‘bump’ occurred in November, not December. December showed a small monthly increase in sales by volume (+0.2%) but there was a decrease in value index (-0.1%).
[Sales in December are going to be much greater than those in November but the Retail Sales Index is adjusted for such seasonal patterns and the monthly weightings given to each sector also reflect this seasonality.]
One positive-looking graph is the annual changes in the value (+1.1%) and volume (+0.7%)indices. These are both positive for the first time since March 2008. We must be wary though. The CSO can adjust the index for seasonal consumption patterns but they cannot adjust the series for seasonal weather patterns. Sales last December were disrupted by a cold snap that brought snow and ice.
It will only be over the coming months that we will know if the bump seen in November will be maintained. It is difficult to see how the annual rates will stay positive next month. There will have to be a monthly increase in sales value of 2% in January just to ensure that the Value Index does not have a negative annual change.
Here are the monthly changes showing that the recent bump occurred in November.
BBB ratings indicate that expectations of credit risk are currently low. The capacity for payment of financial commitments is considered adequate but adverse business or economic conditions are more likely to impair this capacity.
The Fitch statement on the ratings decision begins
The affirmation of Ireland's sovereign ratings primarily reflects two factors:
- Whilst Fitch has reduced the score assigned to capture financing flexibility in its assessment of the credit profile of those eurozone sovereigns that have large fiscal financing needs and significant financial/economic imbalances, in Ireland's case its 'BBB+'/'F2' rating had already incorporated this lack of financing flexibility as demonstrated by it losing market access in 2010 .
- Ireland's progress with fiscal and structural adjustment under the IMF-EU programme. Notwithstanding the intensification of the eurozone crisis over the last months, on-track fiscal performance and the improvement of macroeconomic and financial fundamentals led to the decline of interconnected fiscal sustainability and financial stability risks and all programme targets have been met.
Not a lot to generate much reaction here though I must have missed “the improvement of macroeconomic fundamentals”. Economic growth? Inflation? Unemployment? There has been some stability but hardly enough to warrant description as an improvement. The full statement is below the fold.
The eight-week downward run in Irish government bond yields continues. Here are the indicative yields as calculated by Bloomberg and their close yesterday.
The five-year yield as calculated by Bloomberg is approaching what could be considered sustainable. In fact both Italy and Spain have been forced to issue bonds at similar rates in the period around Christmas. Here is an image of the eight-week fall.
Before the current crisis the five-year yield on Irish government bonds was generally between 3.5% and 4.0%. Last July this yield was over 17% and getting back to anything like normality before the end of the EU/IMF programme seemed like a forlorn hope.
With the debt mountain we have now accumulated a return to such levels is unlikely. At best we could probably hope to see yields of 4.5% to 5.0%.
Here are the actual closing prices and yields of outstanding government bonds for trades recorded with the Irish Stock Exchange yesterday.
Yesterday’s Troika press conference has attracted more attention than usual because of an exchange between journalist and broadcaster, Vincent Browne and Klaus Masuch, head of EU Countries Division at the European Central Bank. The exchange can be seen here.
Although not named we can only assume that Browne was referring to Anglo Irish Bank. Anglo’s 2008 Annual Report provides details for the year ended 30th September 2008. This is also the date of the guarantee so it gives us a good indication of the liabilities that were guaranteed on the same night.
By the end of September 2008, the Anglo balance sheet had ballooned to a massive €100 billion. On the asset side Anglo had forwarded loans of around €72 billion. We now know that Anglo made losses of around 50% on this loan book. We have filled that €30 billion+ gap.
Then comes the issue of where Anglo got the money to make these loans. The Anglo balance sheets reports €100 billion of liabilities of which over €70 billion were just deposits (€52 billion from ‘customers’, €20 billion from banks). It also shows that there was about €17 billion of 'Debt Securities' (i.e. bonds) in issue at that time.
A note to the accounts gives a breakdown of this total at the 30th September 2008:
Medium term note programme: €10,622 million Other debt securities in issue: €6,658 million
The category of 'other debt securities' includes commercial paper and certificates of deposit which are almost analogous to deposits. There were also some €4 billion of subordinated liabilities but those are not of concern here as most of those were not repaid. [Junior debt holders in the covered banks incurred €15.5 billion of losses across the covered banks.]
Anyway at the end of September 2008 Anglo had €10.6 billion of bonds outstanding. A breakdown showing the amounts of these that were secured and unsecured is not provided. These bonds (along with all other liabilities) were guaranteed on September 30 and over the past three and half years many of these have been repaid. After Monday's payment of €1.25 billion there will be around €3 billion of Anglo bonds left to be repaid.
The issue raised by Browne is the repayment of unsecured bondholders in Anglo after the expiry of the original two-year guarantee in September 2010. Unfortunately for 2010, Anglo changed its year end to 31st December so we cannot get the exact balance sheet position at the expiry of the original guarantee from the 2010 Annual Report.
By the 31st December 2010 the balance sheet of Anglo had shrunk to €72 billion and the total amount of debt securities outstanding had fallen to €6.9 billion. All the deposit-like 'other securities' had been redeemed so the €6.9 billion was all bonds. At this stage the bank was again mainly funded by deposits but these were now almost 80% central bank deposits.
Of the €6.9 billion of bonds we are told that "€3.0bn of medium term notes, all of which are Government guaranteed with maturities of up to five years, were issued during the year." That means there could only be a maximum of €3.9 billion of bonds which were outside the guarantee.
This was confirmed in March 2011 with this release from the Central Bank. This showed that on the 31st March 2011 there was €3,147 million of senior unsecured unguaranteed bonds in Anglo on the 18th of February 2011 from a total of €6,255 million of bonds (the other €3 billion being the guaranteed bonds).
It is the re-payment of these €3.1 billion of unsecured bonds that was the subject of yesterday's exchange. It is hard to know how much could be saved if these bonds weren't repaid but given the 60%-80% haircuts applied to subordinated debt it is likely that a haircut of 40% to 60% would be applied to senior debt. If we take the mid-point and assume that a 50% haircut could be applied then the State will lose around €1.5 billion by repaying these bonds.
Of course, we don’t have the money to repay these bondholders. We have borrowed it (or rather we will borrow it) through the Promissory Notes. Repaying the bonds will not cost us €1.5 billion. The price is €1.5 billion but the cost will be the annual interest payments made on the borrowing to pay the bonds. At an interest rate of 5% it would cost €75 million per year to service €1.5 billion of debt. The true savings of not repaying these bonds is this €75 million per year.
Here is the question and the answer and some subsequent comments from this transcript.
Vincent Browne: “Klaus Masuch, did your taxi driver tell you how the Irish people are bewildered that we are required to pay unguaranteed bondholders billions of euros for debts that the Irish people have no relation to or no bearing with, primarily to bail out or to ensure the solvency of European banks? And if the taxi driver had asked you that question,hat would have been your response? That’s my first question.”
Masuch: “I can understand that this is a difficult decision to be made by the government and there’s no doubt about it but there are different aspects of the problem to be, to be balanced against each other and I can understand that the government came to, came to the view that, all in all, the costs for the, for Irish people, for the, for the stability of the banking system, for the confidence in the banking system of taking a certain action in this respect which you are mentioning could likely have been much bigger than the benefits for the taxpayer which of course would have been there. So the financial sector would have been affected; the confidence of the financial sector would have been negatively affected, and I can understand that there were, that there was a difficult decision but that the decision was taken in this direction.”
Browne: “That, that… Well, that doesn’t address the issue. We are required to pay, in respect of a defunct bank – that has no bearing on the welfare of the Irish people at all – we are required to pay in respect of this defunct bank, billions on unguaranteed bonds in order to ensure the health of European banks. Now how would you explain that situation to the taxi driver that you talked about earlier?”
Masuch: “I think I have addressed the question.”
Browne: “No you haven’t addressed the question because you referred to the viability of the Irish financial institutions. This financial institution I’m talking about is defunct. It’s over. It’s finished. Now, why are the Irish people required, under threat from the ECB, why are the Irish people required to pay billions to unguaranteed bondholders under threat from the ECB?”
In his answer Mausch basically said that it was the government’s view (he never actually have his view) that the benefits of repaying these bonds were greater than the savings that could be made by not repaying them. We know that the saving could be around €1.5 billion.
It would have been useful if Mausch was pressed further on what he felt these benefits were. It is still not clear what benefits, if any, did accrue from undertaking to repay these bonds; it certainly wasn’t “stability of the (Irish) financial system”. There may have been benefits from repaying these bonds and this has been couched in references to veiled threats from the ECB. Would the ECB “pull the plug” if these €3 billion of bonds aren’t repaid? Unlikely, but in the greater scheme of things the €1.5 billion in question here is not the key issued.
The key issue is the €25 billion of Promissory Notes given to Anglo (along with €6 billion to Irish Nationwide) to cover the loan losses referred to above. Most of the money that these Notes allowed Anglo to get from the Central Bank went to repay depositors rather than bondholders.
This issue is how (or whether) we repay the €28.5 billion of these Notes that are still outstanding. This money is owed to the Central Bank of Ireland but when the Central Bank gets it, it will just “burn” it. There is no one waiting for this money to be repaid so the question is why do we have to repay it now. Prof Karl Whelan is once again excellent on this point in this article in Business and Finance.
This issue was raised at both the Noonan/Howling and Troika press conferences. You can listen to the responses in this extract. It seems we can expect some kind of ‘position paper’ to be released before the end of February. This issue is far more significant than some pre-ordained grandstanding about bond payments. The bondholders are gone. The debate must move on. Maybe the next haranguing of the ECB will press them on this.
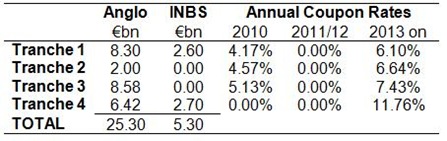
A restructuring of the €31 billion of Promissory Notes given to Anglo Irish Bank and Irish Nationwide (now merged in the Irish Bank Resolution Corporation) has been getting a good deal of attention recently. Much of the focus has been on reducing the interest rate coupon on the Notes but as we have said a number of times it is not clear that this would actually save the State money.
Here is a table of the issued Promissory Notes from a previous post.
When we account for the “interest holiday” taken in 2011 and 2012 the equivalent annual coupon for Tranche 4 is 8.6%. This means that the average annual coupon rate across the €31 billion was about 5.8%.
The interest rate on each tranche was based on the yield Irish government bonds of the same maturity on the day the tranche was provided to Anglo/INBS. This increased from 4.17% to 8.60% as the tranches were issued beginning on the 31st March 2010, though the second and third tranches on the 31st of May and 28th of June 2010, and finishing with the final tranche on the 31st December 2010.
For the first six months of 2011, Anglo reported it had Interest Income of €644 million on the €25.3 billion of Promissory Notes that it had received. The amount of the Promissory Note outstanding was reduced to €23.8 billion when the first annual payment was made on the 31st of March.
The “bank” also paid €519 million of interest to the Central Bank of Ireland for use of Emergency Liquidity Assistance (ELA). The total amount of ELA the bank was drawing down stood at €45.0 billion on the 31st December 2010 and had reduced to €40.8 billion by June 30th 2011. With an haircut of around 20% applied to the use of the Promissory Note as collateral it is clear that the Promissory Notes were supporting about half of the ELA that Anglo was drawing down.
Therefore we could allot around €260 million of interest expense to the ELA backed by the Promissory Notes. In the first six months of 2011 Anglo made an interest profit of around €380 million on its Promissory Notes transactions. As Anglo is 100% state-owned this profit is not lost. Any reduction of the interest rate on the Promissory Notes will simply reduce this profit and no money will be saved.
What about the €519 million of interest Anglo paid to the Central Bank of which around €260 million is due to the Promisory Notes-backed ELA? We don’t have the 2011 Annual Report for the Central Bank of Ireland yet but we we can track the flow of the interest that was paid to the Central Bank over the past few years. This is given under the heading 'Other' in the Income Received total in the Central Bank Annual Reports
2008: n/a 2009: €240.5 million 2010: €510.2 million
Given the level of ELA that was issued during these years it is possible that the interest rate charged was around 2.5%. In 2010, Anglo paid €435 million in interest to the CBoI for ELA so it is clear that the bulk of the ELA was issued to Anglo.
The full extent of the ELA (up to €50 billion) only arose in late 2010 so it will be interesting to track the 'Other' Income Received when the Central Bank publishes the 2011 Annual Report later in the year.
"The Central Bank is in turn getting the money it lends to Anglo from the ECB at a much lower and not disclosed rate which is reported to be 2 per cent or less. It keeps the difference. The real cost to the State is the rate at which the ECB provides cash and it is far from penal."
“While money that comes directly from the ECB is issued for terms ranging from seven days to 90 days, the money given out through ELA is typically granted for seven days.”
I’m not so sure the Central Bank needs to get the money. This might be the case but it is also possible that the Central Bank of Ireland just created the money as only central banks can do.
This little note on the ELA mentions nothing about a payment to the ECB and, says:
The little known ELA facility allows national central banks (NCB) to provide funds to domestic financial institutions in financial difficulty over and above the liquidity provided by the ECB's regular refinancing operations. These operations are separate from the Eurosystem, but the ECB's Governing Council can with a ⅔ majority oppose the granting of further ELA, if, for instance, it considers the emergency assistance provided constitutes monetary financing.
The assistance provided is supposed to be temporary and to an illiquid but solvent financial institution. The lending is not subject to ECB collateral requirements. Thus a bank can present its NCB collateral which would not be acceptable by the ECB (but which would be acceptable by the NCB).
If you really want to get into ELA you can read this five-page note from Citigroup’s Willem Buiter. On the first page it states:
Any profits or losses made from the collateralised lending of NCBs under their ELA facilities are for the account of the NCB alone and are not shared/pooled with the rest of the Eurosystem.
There is lots of technical sounding stuff here but it really throws little light on the subject. To try and track these profits we can look at the Central Bank surplus that is payable to the Exchequer each year. Here it is for the past six years.
2005: €109.2 million 2006: €98.5 million 2007: €183.4 million 2008: €290.1 million 2009: €745.9 million 2010: €671.0 million
There could be other reasons for this but the Central Bank surplus has increased in the period in which the ELA has been provided. The interest received from the ELA doubled to €500 million in 2010 but the Central Bank surplus fell. Again it will be the 2011 Annual Report that will give a more telling indication of the impact of the ELA in the surplus that is transferred to the Exchequer.
We know for definite that the interest profit that Anglo makes on the Promissory Notes is not initially lost as Anglo is 100% state-owned. It remains to be seen what Anglo will do with these profits. It appears that the chunk of the interest that the Central Bank takes for providing the ELA also stays within the State.
Just a few days after John Corrigan of the NTMA said this:
“Our plan would be to try and return to the Treasury Bill market, which is for debt instruments with less than three month maturity, to try and return to that market by mid-year which would represent the first signs of normalisation, and as regards the longer-term market towards the end of 2012 early 2013 but again it is subject to external conditions improving.”
Meanwhile, Greece saw its borrowing rates ease marginally in a bill auction on Tuesday.
The public debt agency said it raised €1.625 billion ($2.06 billion) in a sale of 13-week treasury bills, an interest rate of 4.64 per cent, compared with 4.68 per cent in the last such auction in December.
Demand for the bills was 2.90 times the amount on offer, roughly the same as last month.
Unable to issue long-term debt due to untenably high borrowing costs, it maintains a market presence through regular treasury bill auctions.
While getting back to short-term markets is undoubtedly an important first step, it is a small step and is one that a country with a nine-year yield of 7.5% and a two-year yield of 5.7% should have little problem in achieving. Irish has an outstanding bond maturing in seven weeks that is yielding 2.12%.
For the second time since August, S&P has reaffirmed its BBB+ rating for Irish government bonds. BBB+ is two grades above junk status and is defined as “adequate capacity to meet financial commitments, but more subject to adverse economic conditions”. In August, though, the outlook was Stable, now it is Negative. That implies there is a one-in-three chance of a downgrade over the next two years.
Italy, Portugal and Spain all had two-notch downgrades. Italy has been moved to BBB+ and now stands alongside Ireland. Portugal, which previously had a BBB- lowest investment grade rating, now has a junk status grade of BB. Spain began at AA- and is now at A. As with Ireland the outlook on all of these is Negative. The last of the PIIGS, Greece, did not form part of the current review and remains at the low-junk CC grade and a disorderly default is a growing possibility.
A lot of the current S&P statement explaining the decision on Ireland deals with the general eurozone environment but there are some interesting country-specific elements. Two of these are:
1. All other things being equal, we view the government's fiscal consolidation plan as sufficient to achieve a general government deficit of around 3% of GDP in 2015.
2. We expect the general government net debt burden to fall to about 103% of GDP in 2015, having peaked at 109% in 2013. Our net debt estimates include the impact of the government's €64 billion (40% of GDP) in banking sector recapitalizations during 2008-2011 and €29 billion (18% of GDP) in debt issued by the National Asset Management Agency (NAMA) as of end-2011.
In August they were forecasting that their measure of net debt would peak at 110% of GDP in 2013. That has now being reduced to 109% of GDP (possibly as a result of the double-counting error in the Department of Finance.) The 103% net debt/GDP for 2015 is unchanged. On the general eurozone response to the crisis they state:
1. In our opinion, the political agreement [the fiscal compact of December 9th] does not supply sufficient additional resources or operational flexibility to bolster European rescue operations, or extend enough support for those eurozone sovereigns subjected to heightened market pressures.
2. [.] we believe that a reform process based on a pillar of fiscal austerity alone risks becoming self-defeating, as domestic demand falls in line with consumers' rising concerns about job security and disposable incomes, eroding national tax revenues.
The full text of the S&P statement is below the fold.
The downward slide of Irish government bond yields continued today and the nine-year yield as calculated by Bloomberg finished at 7.91%. Apart from a two-week period at the start of October this is the only time that this has been below 8.0% in the past year. This time last year the yield was at 8.4%.
We can see that no Irish government bond is yielding more than 8%. Michael Noonan has spent the day proclaiming that “Ireland is fully funded until 2013” (or two-thirteen in Noonan-speak). This is true. What happens in 2014?
The €11.9 billion bond due to mature on the 15th January 2014 is now yielding 6.85%. It now costs €94.84 to buy a unit of this bond. Last July this bond could was trading at less than €70 giving a yield of close to 20% (if you could find someone willing to sell). The perceived risk of this bond has dropped considerably in the past six months.
Finally, it is interesting to see the reasonably normal shape of the yield curve for Irish government bonds.
It would be more than reasonably normal if we could knock a few more percentage points off the yields but lets take it one step at a time. It’s a good deal better than this yield curve from just five months ago.
Citigroup’s Chief Economist Willem Buiter’s comments that Ireland will need a second bailout have been getting an inordinate amount of coverage. There have been plenty of observers who have made the same point from as early as the beginning of the EU/IMF programme in November 2010 and even Minister Leo Varadkar admitted as much last last May. “Bailout 2” is not news.
What is more interesting are Buiter’s comments on the prospects of an Irish default. This following are interlaced from two media reports of his Dublin press briefing.
“Ireland needs further assistance,” said Buiter, predicting that although Portugal and Greece will need to restructure their debts and will effectively default, Ireland can avoid going down the same route by having a plan ready in the event a second bailout is needed. (1)
“Ireland is not Portugal, nor is it Greece, but it is, because of the bank debts from September 2008, in very bad fiscal shape,” said Buiter. “I think the politicians and European partners will pursue the option of more generous funding terms before they get to sovereign-debt restructuring.” (2)
One of the primary concessions Ireland should look for is the cost of the Government promissory notes that have been put into Anglo Irish Bank, now known as Irish Bank Resolution Corp, said Buiter. “What Ireland needs to do is refinance expensive debt more cheaply,” said Buiter, saying that a deal on the notes would provide the Government with “material help”. Minister for Finance Michael Noonan was reported to be attempting to convince the European Central Bank to lower the cost of the notes last month, ultimately unsuccessfully. Buiter said that although these notes carry an interest rate of 6% or 7%, the ECB could shoulder some of the burden and that in time it may decide to do so. (1)
Buiter said a refinancing of 30 billion euros ($38.2 billion) of so-called promissory notes that Ireland used to recapitalize Anglo Irish Bank Corp., recently renamed Irish Bank Resolution Corp., at a rate of about 3 percent through the euro region’s bailout fund would “be a material help.” It “would also politically show a recognition of Ireland’s extraordinary efforts to get its fiscal house in order.” (2)
So Ireland can avoid a debt restructuring (default) if it has a “plan ready”. As agreed last July Ireland will have access to EU funds after the end of the current programme in 2013 when they said that “ We are determined to continue to provide support to countries under programmes until they have regained market access, provided they successfully implement those programmes.” So part A is all sewn up.
Part B is a restructuring of the Promissory Notes. Unless we can get a reduction in the €31 billion capital amount I’m not sure there are substantial savings by reducing the interest rates on the Promissory Notes. The notes have an interest rate of up to 8% but we are not paying the interest to a third party. The Exchequer pays the interest to the IBRC who in turn pay it to the Central Bank. This was summed up by Lorcan Roche Kelly with this neat graphic.
This is somewhat paraphrased from the original post (apologies to Lorcan who was making a related but different point).
The interest on the current promissory note is set with reference to the 10 year Irish bond yield. This note could be set with reference to anything and it doesn’t really matter. We will either be paying the interest to a bank that we own, or to a central bank that we own. We pay them €1 bn, they make profit of €1 bn and pay that back to their shareholder – the state. The payment is circular, so the interest rate doesn’t matter, we are paying it to ourselves.
Most important is the term (the point in the future where we actually pay this back). Ireland does not need to worry about any debt roll-overs coming in the near future, so make it a 100 yr term. We will ‘promise’ to have this paid back by the 2111. Hopefully, inflation will have taken care of some of the burden by then. With this exceptionally long term ,we are not disadvantaging any of our creditors, because they will have been paid their money up front, via the nationalised banks. The drop on the ‘real’ value of the debt will not matter at all, because we owe the money to ourselves.
Buiter wants the interest rate reduced from an interest rate of 6% or 7% to about 3%. This actually doesn’t save us anything. What if the interest rate was more than doubled to 15%? Would that cost us money?
We would be paying 15% interest to the IBRC (which we own) who would continue to pay the Central Bank of Ireland (which we also own) interest for the €40 billion of Emergency Liquidity Assistance that the IBRC is using. The IBRC would have a surplus on this transaction and this money would be returned to the State as a dividend. The IBRC would make a profit which they can return to us or maybe use to buy golf club memberships for their staff.
The losses in the bank would be covered by the €31 billion of capital provided by the Promissory Notes. The interest has no bearing on that. The details of a restructuring plan for the IBRC have been released by TheStory.ie. This says that:
The total cost to the taxpayer for IBRC under the stress case is estimated at €35.8bn
The State has provided €30.9 billion of Promissory Notes and a €4.1 billion direct cash injection into the entities that make up the IBRC. This is €0.8 billion short of the total cost estimated under the “stress” case. That cost of the Anglo/INBS debacle is going to be around €35 billion and we have already provided that money. The issue is how we repay it.
To followed Buiter’s advice and to somehow convert or transfer the Promissory Notes over to the one of the EU bailout funds would actually be a mistake. Even if this was done at 3% we would be paying the 3% to an external entity and the interest would be lost. It is better to be paying 7% to ourselves rather than 3% to someone else.
Of course we are involved in the slow-scale transformation of the Promissory Note debt into lower interest debt through the €3.1 billion annual repayment at the end of March. There are now €28 billion of the original Promissory Notes outstanding following the first payment last year. To money to make the payment came from the Exchequer which is borrowing from the EU/IMF at an average rate of 3.55% to fund the deficit.
This coming March we will make an further €3.1 billion payment. This transforms the debt from €3.1 billion of Promissory Notes owed to the IBRC to €3.1 billion of loans owed to the EU/IMF. This does not increase our debt but instead of paying interest on this debt to the IBRC we will be paying interest to the EU or IMF. From 2013 this process will slow considerably as the interest due on the Promissory Notes start to be accrued from then. See here. Over time the Promissory Note debt will be refinanced to “cheaper” debt but is this actually a good thing?
As Lorcan correctly points out it is the term that matters. Why should we be repaying the Promissory Notes now? The interest rate doesn’t really matter and nobody really loses if we repay them 100 years from now. The only ‘cost’ is that there is around €30 billion of cash floating around that the Central Bank of Ireland (or the ECB more like) would like to see “put back in the vault”.
But why do we have to do this now we the State is in a hugely distressed financial position? Why not give the €30 billion back to the Central Bank 20, 50 or even 100 years from now as Lorcan suggests. Prof. Karl Whelan has been excellent on this point here and here, and explains it in much clearer terms.
Willem Buiter thinks that Ireland needs a two-point plan that will enable us to avoid a sovereign default. This is a reasonably positive diagnosis. “The patient is sick, but he will survive” could be one way of putting it.
We will get the official funding that he (and practically everyone else) thinks we need. We might get to “refinance expensive debt more cheaply” through a reduction in the interest rate on the Promissory Notes by transferring them to either the EFSF or EFSM. However, rather than being of benefit to us that could actually cost us money. What we need is to stop repaying them until we are in a far better position to do so.
Here is an update of a table showing the interest rates on the loans we are getting as part of the EU/IMF programme (HT: Kevin). The data is for loans drawn down as of the 14th of November 2011. Click image to enlarge.
When we last looked at this back in August for loans drawn down by June the average interest rate was 5.58%. We can now see that this has been reduced to 3.55%. This is because of the reduction in the EU loans agreed at the EU summit on July 21st last.
The interest rate on loans from the European Financial Stability Mechanism (EFSM) has fallen from 6.99% to 2.97%, while the interest rate on loans from the European Financial Stability Fund (EFSF) has fallen from 5.90% to 3.06%.
The highest rate is the 4.83% that applied to the UK bilateral loan but that is due to be reduced. As a result of this the IMF loans will have the highest rates but they could also be reduced as there are some suggested changes to Ireland’s quota with the IMF.
A previous post suggested we need to source around €25 billion of funding to get through 2014, as the €67.5 billion of funds under the current EU/IMF programme will be exhausted by the end of 2013. From the above we can see that we need to be in a position to begin repaying the EU/IMF loans (by borrowing from someone else) from July 2015.
Replacing funding that comes at a cost of 3.55% will not be easy but for the moment it does keep a cap on our interest payments.
Over the next two years the Irish government needs about €46 billion of funding.
We still have to draw down around €33.5 billion of the loans agreed as part of the EU/IMF programme. The remaining €12.5 billion can come from a combination of our existing resources, State Savings Schemes and some market funds.
There was €13 billion in the Exchequer Account at the end of 2011. The NTMA have suggested that this could be reduced to around €5 billion over the next two years although the European Commission have indicated that they would prefer to see the cash buffer maintained at its current level.
It is forecast that €1.5 billion a year will be raised from the State Savings Schemes over the next two years. This is well above the 2000-2007 average but in line with performance over the last few years. At €1.36 billion the amount raised in 2011 was just below this.
If the €1.5 billion a year is achieved then the State needs around €10 billion to see it through to the end of 2013. We have €13 billion of cash on deposit (and there is also around €5 billion remaining in the National Pension Reserve Fund (NPRF)).
How much of this cash is used will depend on how much market funding can be raised. The plan for the NTMA to “dip its toe” back in the markets before the end of this year, but given the amount of cash on reserve this can be delayed until 2013.
All told the State is in a reasonably secure position for the next 24 months (where ‘reasonably secure’ simply means we won’t run out of money). After that there is the small matter of a €12 billion bond maturing in on the 15th January 2014.
We are due to begin repaying some of the EU and IMF loans in 2015 and there is also the need t0 find funding for the €10 billion Exchequer deficit due to arise in 2014 and the €7 billion deficit in 2015.
While the plan is to “dip” back into bond markets before the end of 2012 we have to ensure that we have the capacity to meet the €12 billion debt rollover in January 2014 and that year’s €10 billion Exchequer deficit. Even if the balance on the Exchequer Account is allowed to fall from €13 billion to €5 billion we will still need to raise around €25 billion of market funding by the end of 2014.
This will be a challenge but we will not face a crunch until the start of 2014 and there is a lot that can happen over the next two years.
Although have we been “shut out” of bond markets, the EU/IMF is not the only remaining source of funding for the State. The National Treasury Management Agency (NTMA) run a series of State Savings Schemes and they have seen a substantial inflow of funds in the last few years.
After seeing annual increases of no more than a couple of hundred million between 2001 and 2006 and even a reduction in 2007 the annual change in the amount held in various State Savings Schemes soared from 2008 on. In 2010 almost €3 billion was put into this schemes and this dropped to under €1.5 billion in 2011.
The total amount in the schemes is almost €12 billion.
We don’t have details for 2011 yet, but the NTMA’s 2010 Annual Report gives some insight into the breakdown of the total amounts and annual changes for the different schemes in 2010 when inflows peaked at about €3 billion.
There was also close to €2.5 billion is various Post Office Savings Bank Deposit Accounts (including savings stamps) which took in almost €500 million in 2010.
Although small in the greater scheme of things this source of funding makes a useful contribution. An added advantage is that is cheap, the average interest rate is likely to be less than 3%. The average rate of the EU/IMF funds we had drawn down by the middle of November 2011 was 3.55%. At the end of 2011 the €12 billion in the State Savings Schemes will make up around 7.5% of Ireland’s General Government Debt.
On the 6th of January 2011 the yield as given by Bloomberg closed at 8.80%. Today it finished at 8.13%. In relative terms these bonds are viewed as a lower risk now then they were 12 months ago.
We can’t infer a huge amount from these changes. The volume may not be very high and we cannot be sure who is doing the buying, if any. Also we will not be borrowing from these markets any time soon so there is no direct impact from these changes.
The relative performance of 9-year Irish (green) and 10-year Italian (orange) bond yields for the past month has been markedly different.
We seem to spend an inordinate amount of time going through every possible representation of the tax revenue figures in the Exchequer Statements. The latest post is a good example of this. Why not devote even a fraction of this attention to the expenditure figures in the Exchequer Statements?
The answer of course is that the Exchequer Statements do not contain expenditure data that can be analysed in any meaningful fashion. The appendix with the Analysis of Net Voted Expenditures shows that net voted expenditure was €45,711 million in 2011; in 2010 it was €721 million higher at €46,432 million. What does this mean?
It is very hard to say. Net voted expenditure is gross expenditure adjusted for departmental receipts (known as appropriations-in-aid). If net expenditure changes it can be difficult to determine if this is as a result of expenditure changes or changes in departmental receipts.
This leads to statements like the following in the Information Note to this month’s Exchequer Statement:
The underspend on the Social Protection Vote was due to higher than expected PRSI receipts, which more than offset overspends on a number of schemes, including Jobseekers Allowance.
Huh. Spending is down because receipts are up. Underspending and overspending in the same sentence. All in all it is almost impossible to tell if spending is up or down. There are changes and adjustments in the tax revenue figures but in general they are easier to track, and more information is presented, than those in the expenditure figures.
Note 4 in the Exchequer Statement indicates that expenditure in health has increased to €12,897 million from €11,578 million in 2010. In the current era of austerity and expenditure cuts it seems unusual to suggest that expenditure in health increased by 11.4% in the last year. Of course, this is nonsense but that is what the Exchequer Statement shows.
The reason for the change is the abolition of the Health Levy. In 2010, the Health Levy was a departmental receipt for the Department of Health. The receipts of €2,018 million were subtracted from gross expenditure to get the net expenditure figure for health reported in the Exchequer Statements.
Although net voted expenditure for health has risen we cannot use this to say that we are spending more money on health. We don’t get monthly updates of actual (i.e. gross) expenditure in the Exchequer Statements but we can get the annual figures from the Databank provided by the Department of Public Expenditure and Reform.
Gross expenditure in health fell from €15,169 million in 2010 to €14,316 million in 2011. There was a 5.6% reduction in expenditure in health in 2011 but it is impossible to determine this from the monthly Exchequer Statements. It would be extremely useful if the gross expenditure figures were also provided in the monthly Exchequer Returns.
As it is the best we can do are annual tables like the following for the Health Group.
Reporting net expenditure figures as is done in the Exchequer Statement has no impact on the reported Exchequer balance but we do not see how the figure is reached. Even if monthly gross expenditure figures were provided for every department there would still be difficulties due to the abolition and creation of some departments and changes in the functions and responsibilities of others.
Anyway, the conclusion is that expenditure in health fell in 2011, particularly non-pay expenditure of the HSE (-8.5%) and the Office of the Minister for Children (-45.3%) even if the Exchequer Statement is reporting an increase in “net” expenditure. As a result of issues like this there is little value in spending much time exploring the expenditure figures in the Exchequer Statements.
Here we will have a look at the figures in the usual detail. First up cumulative tax revenue by month.
Cumulative tax revenue has been ahead of the 2010 outturn for every month of the year. The increase peaked in September at 8.7% (when the new pension levy was collected) and has eased since then to finish the year up €2.3 billion or 7.2%. This has been hailed as the first rise in tax revenue in three years.
By looking at the individual tax heads we can see that virtually all of this increase is due to Income Tax.
The CSO reports that employment fell 46,000 in the year to September and that average weekly earnings rose 1.4% over the same period. These do not seem like labour market indicators that support a 22.4% rise in Income Tax. Budget 2011 contained a series of measures that were forecast to bring in about an extra €1 billion of Income Tax in 2011. So where did the other €1.5 billion come from?
It came about as a result of the reclassification of the old Health Levy into the new Universal Social Charge. The Health Levy was a departmental receipt collected by the Department of Health and did not appear in the Exchequer Account. All money collected under the Universal Social Charge enters the Exchequer Account and is included under the Income Tax heading.
In 2010 the Health Levy raised €2,018 million. This money was collected again in 2011 but under the guise of the Universal Social Charge in Income Tax receipts rather than as a receipt for the Department of Health. There might have been an increase in tax revenue in the Exchequer Account but there was little or no increase in government revenue.
The other tax showing a strong increase on 2010 is Stamp Duty. As we said when the September Exchequer Statement was released:
This again is not the positive sign the bare numbers would suggest. Stamp Duty is only up because the €457 million collected as a result of the Pension Levy introduced in May’s “Jobs Initiative” is included here. If we compare like-for-like Stamp Duty revenue is performing just like every other tax – i.e. worse than last year.
VAT is down €360 million but about one-third of that is due to the reduction in the 13.5% to 9% for certain goods and services in the same Jobs Initiative.
On a monthly comparison every month was ahead of the 2010 equivalent bar one: the last one. Tax revenue for December 2011 was €51 million lower than in December 2010.
If we look at the individual tax heads we can see the causes of this.
The standout figure is obviously the 96% drop in Corporation Tax receipts. The Information Note offers an explanation for this:
[…] some €261 million in corporation tax receipts due for receipt in December were not received into the Exchequer account in time to be accounted for in 2011. The bulk of these receipts have since been received and will form part of the January 2012 tax revenue outturn.
It is not really clear what has happened but this will add a bit of new year ‘pep’ to the Exchequer Returns in 2012.
If we just look at the last quarter of 2011 the picture is a little more benign.
Apart from the continued weakness in VAT receipts and the glitch in Corporation Tax all tax heads in the final quarter of 2011 are ahead of their performance from 2010. The 40% rises in Capital Gains and Capital Acquisitions Taxes are noteworthy, but the contribution of these taxes to total tax revenue remains small (just 5.8%).
No analysis of Tax Revenue is complete without investigating whether receipts are “on target” which were published last February. They’re not.
Tax revenue in the final quarter of the year might be up on its 2010 performance but it is clear that the Department of Finance was expecting a much greater bounce. Over the last three months of the year tax revenue went from being €160 million ahead of target to €873 million behind target. If we omit the measures introduced in the Jobs Initiative that did not exist when these targets were set it is likely that tax revenue is around €1,200 million or 3.5% below target.
In each the last three months of the year tax revenue was more than €330 million behind the DoF forecast. It was hoped that there would be a rise of €1,383 million to €10,962 million of tax receipts in the final quarter. It is not clear why the DoF expected a 15% rise in tax revenue in the final quarter of the year but receipts were actually €9,929 million, almost 10% below target.
For the year as a whole three of the four main tax heads are significantly below their target and the overshoot in Excise Duty is a relatively inconsequential €3 million.
The tax to strongly outperform the target for it set last January is Stamp Duty and this is only because €457 million was collected from a 0.6% private sector pension levy that was only introduced in May. On that basis of what was to be collected at the time the forecast was made Stamp Duty is also below target.
If we look at the last quarter of the year when it all went wrong.
There is some cover for the almost 25% underperformance of Corporation Tax, but even if the €261 million of delayed receipts are added in Corporation Tax receipts would still be 10.8% behind the target for the quarter. The largest taxes for the quarter were forecast to be Income Tax and VAT and these were both almost 10% below target.
To be fair the performance in December was slightly better.
Although there is plenty of red in the table most of the shortfall is due to the Corporation Tax issue. There is no such explanation for the large undershooting of tax receipts in October and November that is reflected in the quarterly table above.
For 2012 the Department are forecasting a 5.3% increase in tax revenue.
This is largely based on a €1.2 billion increase in Income Tax receipts during the year. Budget 2012 contained no Income Tax measures so this €1.2 billion increase will have to be the result of the carryover from the measures introduced in the 2011 Budget (estimated at €600 million) and a general upturn in Income Tax receipts (accounting for the remaining €600 million). I can’t say that I can see that coming down the track.


