Saturday, December 29, 2012

Irish Examiner 22/12/12

The unedited text of an article that appeared in The Irish Examiner recently is continued below the fold.

We need to face up to the repossession crisis

According to the latest mortgage arrears statistics there are 33,000 households in arrears of between 90 and 360 days and a further 35,000 households in arrears of more than 360 days. Both figures continue to rise. There is an expectation that they will level off in the middle of next year but we will have to wait for evidence of that to emerge.

Beneath this there are 39,000 households in early arrears of less than 90 days and a further 34,000 households who have had their mortgage restructured but are not in arrears. Across all levels there are around 150,000 households showing some sign of mortgage distress from very mild to very severe levels.

Research by the Central Bank shows that 44% of borrowers who fall into 90 day arrears return to performing mortgages over time. It is likely that 100,000 households need some form of intervention.

Thursday, December 20, 2012

Taxing with the best of them

Ireland continues to face a massive budget deficit.  In 2013, the deficit is forecast to be 7.5% of GDP which will be the largest in the EU.  There are almost incessant arguments on how best to close the deficit. One common refrain is that Ireland is a “low-tax economy” and that the gap should be closed with tax increases, in particular increases in income tax on the “rich”.

When it comes to income tax, there is not much evidence at an aggregate level to support the thesis that Ireland is “low-tax”.  In fact as a percentage of GDP, Ireland collects the eighth highest amount of income tax in the EU and is equal to the EU average.  Here are 2011 figures from Eurostat on personal income tax as a percent of GDP.

Individual Income Tax EU

Ireland’s social contributions rates are low and on a combined measure of income tax and employee social contributions Ireland ranks 13th in the EU on 10.5% of GDP below the EU27 average of 13.0%.  Table here. (Though the Irish figure is 12.7% of GNP).

Income Tax plus Social Contributions

In 2013, it is projected that there will be a general government deficit of €12.7 billion.  Around one-ninth of this will be because of the deficit in the Social Insurance Fund.  It is forecast for 2013 that there will be €7.1 billion of PRSI contributions, while there will be €8.6 billion of claims on the Social Insurance Fund.  More PRSI is needed to fund the expenditure of the social insurance fund but the deficit is a little less than 1% of GDP.

We could choose to move higher in the above table using employee social contributions.  However, as this table (excel) from the OECD shows, all 34 countries in the OECD adopt a flat-rate system for employee social contributions.  This approach may not be attractive to all owing to the lack of progressiveness in the measure.  The deficit in the Social Insurance Fund could be closed by upping the employee PRSI contribution rate from 4% to 7%. 

However, the main hole in the public finances is for expenditure financed out of general taxation.  Of course, there could be further increases in employee PRSI contributions beyond that necessary to close the deficit in the SIF up to say the 12.5% average for the OECD-EU21, with scope to also increase employer and self-employed social contributions.   Such an increase could be accompanied with the transfer of the funding of certain expenditures from the Exchequer to the Social Insurance Fund, thereby reducing the need for tax increases. 

Accepting that is possible, let’s assume that tax-funded expenditure continues to be tax funded and we are looking to raise additional tax revenue, and in particular income tax revenue.  Let’s see how some of those countries with higher income tax receipts than Ireland manage it.  This table (excel) from the OECD gives effective income tax rates at different income levels.

For Ireland, it gives effective income tax rates and tax bills (income tax plus USC) for a single person with no children at the following wage levels:

  • 67% of Average Wage: €22,000 = 8.8% with €1,900 tax
  • 100% of Average Wage: €32,800 = 14.9% with €4,400 tax
  • 167% of Average Wage: €55,000 = 28.1% with €15,400 tax

Ireland has a progressive tax system.  In fact it is the second most progressive in the OECD and the most progressive in the EU.

The following table shows what happens to personal tax bills if we apply the effective income tax rates of the six EU countries who collect more than 10% of GDP from personal income tax.  These countries are Denmark, Sweden, Finland, Belgium, Italy, the UK.  In the table their effective tax rates (as well as their mean) at 67%, 100% and 167% of the average wage is applied to those wage levels in Ireland? 

Tax system are complicated so this crude analysis may miss some of the finer points of each system but it gives a good impression what would happen if the effective tax rates from the top income-tax-collecting countries were applied in Ireland.

Tax Bills

Ouch!  Unsurprisingly, 20 out of 21 of the country rates result in an income tax increase.  The only reduction is in the case of the UK effective tax rate for those earning 167% of the average wage.

The arithmetic average of the effective income tax rates for the six countries implies tax increases at all three income levels, but the size of the tax increases varies hugely.  If applied those on €22,000 would see their tax bill more than double, those on €32,800 would see their tax bill increase by half and those on €54,800 would see their tax bill rise by around one-twelfth. 

In proportionate terms the hit would be 13 times greater for those on €22,000 than those on €54,800.  The extra tax on €22,000 would around €170 a month, the extra tax on €54,800 would be €95 a month.  And increases in flat-rate employee social insurance contributions might be dismissed because they are not progressive!  Adopting the average effective tax rates of these six countries for single people with no children would be monstrously regressive.

We can collect as much income tax as Denmark, Sweden and Finland but let’s be clear how they do it.  Countries with higher tax income revenues as a percentage of GDP than Ireland do not achieve it by levying more taxes on higher incomes (€55,000 would be in the top quintile of earnings in Ireland), they do so by levying more taxes on average incomes and much more taxes on lower incomes.

An equivalent table for married couple with two children looking at the effective income tax rate less child-related transfers is below the fold.

Wednesday, December 19, 2012

Some Trends in Expenditure

Chapter 21 of the 2011 Comptroller and Auditor General’s Account of Public Services includes the following chart on trends in welfare expenditure.

Trends in Welfare Expenditure

The figures since 2008 used in the above table are in the first section of this table.

Trends in Welfare Expenditure Table

The 2012 figure is an estimated based on voted allocations at the time of the report (Sep 2012).  Since then there has been a supplementary estimate for the Department of Social Protection of €685 million, of which €264 million was due to more than anticipated expenditure on Jobseeker’s Allowance.  Thus the 2012 total for support for ‘people in the labour market’ will be around €5,200 million and the overall total for the table close to €21,000 million, with little overall change from 2011.

The trends in the chart are easily identifiable.  There have been falls in the aggregate financial support provided to ‘families and children’ and to ‘people in the labour market’.  Support for ‘people with disabilities’ fell in 2010 and 2011 but is due to rise very slightly in 2012.  Support for ‘older people’ continues to rise year-on-year with a rise of around €1 billion since 2007.  A more detailed breakdown of the expenditure under each category is in tables below the fold at the end of the post.

Here is a table taken from the Analysis of the Exchequer Pay and Pensions Bill published by the Department of Public Expenditure and Reform.

Exchequer Pay and Pensions

It can be seen that the gross Exchequer pay and pensions bill is forecast to rise in 2012, though only by €16 million or 0.09%.  The subsequent column show the breakdown of this.  The Exchequer pensions bill will rise by €285 million, while the gross pay bill will fall by €269 million.

The Exchequer net pay bill is the gross bill less employee pension contributions in the civil service, health, education, guards and army of €536 million which are used to fund other expenditure and the employee deductions for the public sector pension levy of €930 million across all departments which are also used to fund other expenditure.  Some other minor employee contributions bring the total to €1,509 million.  In essence, this is money that forms part of the gross pay bill but is deducted. 

The Exchequer net pay bill is expected to fall by €266 million this year to €14,402 million.  PRSI, Income Tax and the USC will be further collected on this to reflect the net pay measure from the employee’s perspective.

The fall in the pay bill in 2012 (both gross and net) was more than offset by the rise in the pensions bill which has risen €1 billion since 2007.

Since 2007, the social welfare bill for state pensions and the exchequer pensions bill has risen by around €2 billion.  Many of the reductions in current expenditure elsewhere are being consumed by increases here. 

Of course, this is mainly because of demographic factors rather than policy changes.  The number of people aged 65 and over increases by around 20,000 per annum as entrants to this category is greater than the death rate, while the number of public sector pensioners is rising by around 8,000 per annum.

Tuesday, December 18, 2012

Q3 National Accounts

The CSO have published the Quarterly National Accounts and Balance of Payments for Q3 2012.  It is estimated that real GDP rose 0.2% in the quarter while real GNP fell –0.4% in the quarter.

The first estimates of the Q2 2012 changes provided in September have both been revised up, from 0.0% to 0.4% for GDP and from 4.3% to 4.7% for GNP.

Personal Consumption Expenditure rose 0.5% in the quarter, Investment rose 8.5% with a 0.3% quarterly fall in the measure of Government Expenditure included in the accounts.  For the first time in seven quarters Consumption shows an annual rise.  The measure of Final Domestic Demand rose by 1.9% in real terms in the quarter and shows an annual increase of 0.3%.  This is the first annual rise in 18 quarters for Final Domestic Demand (back to Q1 2008).

In 2010 prices, GDP in the first three quarters of 2011 was €119.3 billion.  For the first three quarters of 2012 the equivalent figure is €120.2 billion.  This represents an annual growth rate of 0.8%.  The equivalent figure for GNP is 3.0%.

For Maastricht criteria buffs, nominal GDP in the first three quarters of 2012 is estimated to be €123.3 billion, compared to €119.1 billion in 2011, for a nominal GDP growth rate of 3.5%.

Quarterly GDP rose less than Final Domestic Demand because of a fall in the in the balance of trade.  In real terms, seasonally adjusted exports rose 0.3% in the quarter but imports rose by more with an increase of 2.1%.

In the Balance of Payments the estimated surplus for the first three quarters of the year is 4.3% of GDP up from 0.0% last year.

A‘Low-tax’ or ‘Low-insured’ Economy?

Ireland is commonly cited as a ‘low-tax’ economy with support coming from charts such as this from Eurostat based on 2010 data.

800px-5_Breakdown_of_tax_revenue_by_country_and_by_main_tax_categories(percentage_of_GDP)

Ireland is in a class of EU countries with government revenue below 30% of GDP, 10 points below the EU average.  The other EU countries in this group are Bulgaria, Latvia, Lithuania, Romania and Slovakia.

Graphs such as this are worth some closer study.  For a start the graph is in terms of GDP, whereas for Ireland a comparison to GNP may be a better reflection of the tax burden, though both have merits.  It may also be the case that Ireland is not a ‘low-tax’ economy but more a ‘low-insured’ economy. 

The following table includes 2011 data from Eurostat and gives government receipts as a percentage of GDP for the EU27, the EU 15 and Ireland with a GNP comparison for Ireland in the final column.

Government Receipts 2011

In GDP terms tax receipts in Ireland are a couple of percentage points below the EU averages, but when done in GNP terms, tax revenue in Ireland is above both EU averages.  The reason Ireland appears to be ‘low-tax’ is not to do with tax at all; it is to do with social insurance contributions.  Social contributions in Ireland were always well below the EU average, but with the abolition of the Health Levy in 2011, social contributions in Ireland are now less than half the EU averages. 

In GNP terms employer social contributions are about 55% of the EU average, employee contributions are about 40% of the EU average and self-employed contributions are about 12.5% of the EU average.

Any intention to increase general government receipts in Ireland up to the EU average can propose to either push tax receipts further above the EU average or bring social insurance contributions up closer to the EU average.

Below the fold is a table extracted from the OECD’s Taxing Income publication which looks at effective tax and social contribution rate for different wage levels in 34 OECD countries.

Wednesday, December 12, 2012

Carryover Effects

Here is an extract from Table 2.1 from the Medium Term Fiscal Statement published before Budget 2012 last year.

2012 Consolidation

The 2012 Budget a few weeks later outlined the €1.45 billion of current expenditure cuts and the €1 billion of taxation increases.  With pre-announced cuts in capital expenditure and the taxation carryover effects from 2011 the total added to €3.8 billion.  There also was €0.4 billion of revenue carryover effects for 2012 from the introduction of the USC in 2011 but these were excluded in the table.  The total could then be put at €4.2 billion as was done by both the EU and IMF.

The €1.45 billion of new current expenditure measures is confirmed in table 5 on page 13 of the Economic and Fiscal Outlook released with the Budget.

Here is the equivalent, though slightly modified, table for Budget 2013.

2013 Consolidation

The total sums to €3.5 billion but the “Tax” heading is replaced by “Revenue”.  This is because PRSI was moved from Expenditure to Revenue in the 2013 table. (PRSI is a departmental receipt (appropriation-in-aid) which reduces net expenditure).  Other revenue raising measures such as the third-level registration fee and charges for private patients in public hospitals remain under the “Expenditure” heading.

While in Budget 2012, €1.45 billion of current expenditure cuts were included in the table and subsequently introduced (though not necessarily implemented), for Budget 2013, €1.44 billion of current expenditure cuts were included in the table but €1.02 billion of current expenditure cuts were included in the budget.  This can be seen from Table 7  on page 14 of the Economic and Fiscal Outlook released with the budget. 

The €1.44 billion figure in the table for current expenditure cuts is reached with the inclusion of €0.42 billion of “carryover” effects from measures announced in previous budgets.  That is, the full-year effect of earlier measures won’t be felt until 2013 and these will serve to reduce expenditure in 2013.

However, for 2012 no expenditure carryover effects from the impact of measures announced in previous budgets were included.  The expenditure carryover effect was left out of the calculation of the total consolidation effort for Budget 2012, but included in the calculation of the total consolidation effort for Budget 2013.  Were there no expenditure carryovers coming into 2012 while there was €0.4 billion of them for 2013?

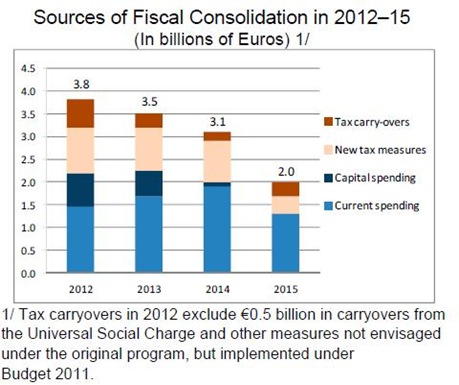
The inclusion of “Increased Dividends” as a consolidation measure also seems unusual and wasn’t included in this graph of Fiscal Consolidation 2012-2015 included as part of the IMF’s Fourth Review (page 13):

2012-2015 Fiscal Consolidation

There is no distinction made between the current spending measures for 2012 and 2013, and as seen the €3.5 billion total for 2013 includes €0.4 billion of expenditure carryovers rather than being entirely new measures.  This was what was included in relation to Budget 2013 in the IMF’s Seventh Review released in September:

On the basis of the aggregate budgetary projections set out in the Medium Term Fiscal Statement (MTFS) of November 2011, consolidation measures for 2013 will amount to at least €3.5 billion. The following measures are proposed for 2013 on the basis of the MTFS:

    • Revenue measures to raise at least €1.25 billion[2], including:
      • A broadening of personal income tax base.
      • A value-based property tax.
      • A restructuring of motor taxation.
      • A reduction in general tax expenditures.
      • An increase in excise duty and other indirect taxes.
    • Expenditure reductions necessary to achieve an upper limit on voted expenditure of €54 billion, which will involve consolidation measures of €2.25 billion on the basis of the MTFS, including:
      • Social expenditure reductions.
      • Reduction in the total pay and pensions bill.
      • Other programme expenditure, and reductions in capital expenditure.

[2] Inclusive of carryover from 2012.

Carryover effects are included for revenue but not expenditure.  It can also be seen than a €54 billion limit for voted expenditure in indicated.  This was not adhered to in the budget:

  • Gross voted current expenditure: €51,070 million
  • Gross voted capital expenditure: €3,435 million
  • Gross voted expenditure: €54,505 million

The excess over the limit is not very different from the level of carryover effects in the current expenditure consolidation effort included in the budget, but is more than likely because the current expenditure ceilings for 2013 laid out last year were increased.

One final point on carryovers relates to the tax carryovers in 2014.  Last week’s budget contained a lot of tax measures which will not come into full effect until 2014. Some of the main measures are:

  • Full introduction of Property Tax less NPPR: €180 million
  • Taxation of maternity benefit: €25 million
  • Removal of PRSI allowance: €26 million
  • Removal of PRSI block exemption: €24 million
  • Changes to maximum allowable pension fund: €250 million

These sum for more than €0.5 billion, though some reduced taxation measures will reduce the full carryover effect to close to €0.45 billion.  If €1.1 billion of tax consolidation is required in Budget 2014, then €0.65 billion of new measures will be required.

Friday, December 7, 2012

New Budgetary Measures

The following table summarises the new measures included in Budget 2012 and Budget 2013 that impact on the White Paper ‘no policy change’ figures released the Friday before each budget. 

Most of the figures come from the Economic and Fiscal Outlook released with each budget (Table 5 for 2012 and Table 7 for 2013).  The current expenditure figures for each Vote are taken from the Expenditure Allocations (2012 and 2013).

BUdgetary Measures

The new Property Tax is expected to raise €250 million but as it replaces the Household Charge a figure of €90 million is included here.  

The total for 2013 is more €726 million than the total for 2012.  This is because of a lower capital reduction in 2013 and also because the White Paper for 2013 was done on the basis of expenditure ceilings which were issued with last year’s budget as part of the Comprehensive Expenditure Review.

The level of current expenditure savings  included in Budget 2013 is comparable to those in Budget 2012, but increases in the current expenditure ceilings for most votes partially offsets the impact of the savings.  A table that compares the expenditure ceilings for each vote as announced last year and adjusted this year is below the fold.

Thursday, December 6, 2012

The General Government Accounts

The Economic and Fiscal Outlook released with yesterday’s budget presents a useful table of the general government accounts.  This is the accruals-based set of accounts by which the Excessive Deficit Procedure limits under the Maastricht Treaty are set.  It is the deficit on these accounts that must be reduced to below the 3% of GDP limit by 2015. Click to enlarge.

General Government Receipts and Expenditure

The €13.4 billion deficit for 2012 is the result of expenditure at €69.1 billion and income at €55.6 billion.  When the projected deficit gets below the 3% of GDP limit in 2015 it will still be €5.3 billion and this will be the result of expenditure at €68.4 billion and income at €63.1 billion.

In nominal terms over the next three years general government expenditure is projected to fall by 0.9% with nominal general government revenue due to rise by 13.3%. 

With inflation and rising GDP, real expenditure will fall while there will be a slight rise in real income.  As a percentage of GDP, expenditure will fall from 42.3% in 2012 to 37.7% 2015.  On the revenue side, the change will be from 34.1% of GDP in 2012 to 34.8% of GDP in 2015.  As shown below this is projected to bring the deficit to 2.9% of GDP by 2015.

Underlying General Government Balance

Excluding interest payments, it can be seen that the projected improvement in the primary balance is even greater.  This means that although overall nominal expenditure might remain largely unchanged there will be changes in the composition of expenditure with interest consuming a greater amount and standard government expenditure a lower amount.

Wednesday, December 5, 2012

How unequal?

Quote One:

“We were one of the most unequal societies in the western road according to the OCED, during the boom years. The most, … , only two or three countries …”

Really?  In the OCED’s ‘mid-2000s’ table of Gini coefficients Ireland ranked 22 out of 30 countries.   This data is taken from Growing Unequal?: Income Distribution and Poverty in OECD Countries, released in 2008.

OCED Income Inequality

New Zealand, the UK, Italy, Poland, the US, Portugal, Turkey and Mexico all had higher rates of income inequality than Ireland.  Ireland was in the bottom half but there were eight countries with higher gini coefficients, not “two or three”.

Quote Two:

“2008 we were much worse than the EU average”

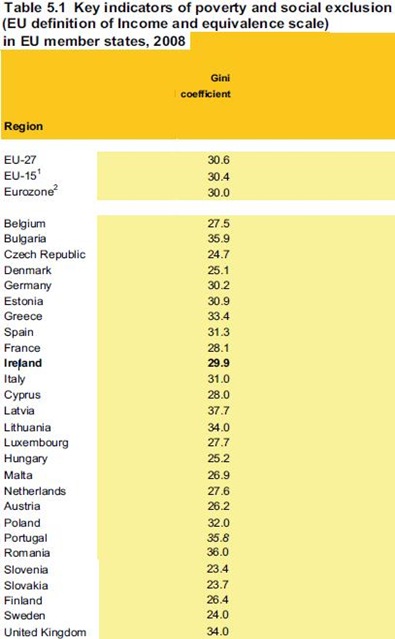
Really?  This is a table of Gini coefficients based on the 2008 EU-SILC (page 97).  Ireland’s gini coefficient of 29.9 was below the average for each of the EU-27, EU-15 and Eurozone countries.

2008 EU SILC Gini

Ireland ranked 15 out of the EU-27.  All of Bulgaria, Germany, Estonia, Greece, Spain, Italy, Latvia, Lithuania, Poland, Portugal, Romania and the UK had higher Gini coefficients (more income inequality) than Ireland.  Ireland was not “much worse” than the EU average.

Quote Three:

“Are you surprised then at how little we do about it [inequality]?

Really?  This is from the same 2008 OECD report which provided the data used above.  Which country had the third best reduction in the Gini coefficient (reduction in income inequality) from the mid-1980s to the mid-2000s?

Trends in Income Inequality

Yes, IRL = Ireland.

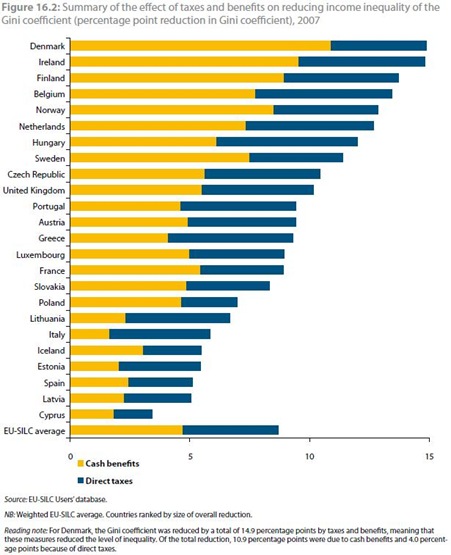
The final graph is from Chapter 16 of a Eurostat report based on the 2007 EU-SILC.  Which country had a system of direct taxes and cash benefits which had the second largest impact on reducing income inequality.

Figure 16.2

In a related table it can be seen that Ireland’s cash transfers reduced the Gini coefficient on original income of 47.2 (the highest in the EU) to 37.7 for gross income (the seventh highest in the EU), while Ireland’s direct taxes further reduced that to 32.4 (the eighth highest in the EU).  These reductions are reflected in the above graph.

Tuesday, December 4, 2012

The Promissory Notes and the Deficit

The impact of the €30.6 billion of Promissory Notes provided to Anglo and INBS, now merged as the IBRC, on the public finances is massive, but is often misstated.  Over the weekend Stephen Donnelly wrote:

Over the course of 2010, the Fianna Fail Government invented a loan from the people of Ireland to Anglo and INBS. They essentially wrote a €31bn IOU, promising to pay it to the bank and building society over the following 20 years. In 2013, we are due to make our third payment on this, of €3.1bn.

But it gets worse. Now that we 'owe' them this €31bn, we must also pay them interest. This amounts to an additional €17bn over the 20 years. In 2013, the interest payment is €1.9bn. So contained in the 2013 forecasts is a payment of €5bn to Anglo and Irish Nationwide – two dead casinos, both under investigation on numerous fronts.

It is expected that Ireland will have a general government deficit of €12.6 billion, a €0.8 billion reduction on 2012.  In an earlier paragraph it is claimed that the 2013 deficit should actually be €15.7 billion.

It is true that the headline figure looked at by the troika will fall by about €800m. But due to some accounting wizardry, a full €3.1bn of the €5bn to be paid to IBRC isn't included. When you add that in, the deficit will in fact grow, by a whopping €2.3bn.

As discussed below this is a mis-interpretation of the impact of the Promissory Notes on the deficit.

Monday, December 3, 2012

Evening Echo 28/11/12

The text of a recent article for The Evening Echo is below the fold.

Printfriendly