Tuesday, May 31, 2011

Central Bank Funding falls but…

The Central Bank have released the April Credit, Money and Banking Statistics.  They should that the reliance of the covered banks on central bank funding has fallen again.

Central Bank Funding

The banks are using €74.2 billion of ECB funding down from €79.2 billion in March and the “Other Assets” category from the Central Bank of Ireland’s balance sheet fell from €66.7 billion to €54.1 billion.  Total reliance of the banks on central bank liquidity is now around €127 billion.  This is a big drop from the level of more than €150 billion recorded in February.

This appears to be a good thing but if we look to see what funds the banks are looking to replace the central banking funding the shine is knocked off this somewhat.  Specifically we look at deposits from Irish residents in the covered banks as this explains most of the above drop.

Irish Resident Deposits in Covered Banks

The reason the covered banks have reduced their demand for central bank liquidity is because of a jump in deposits from government.  The Irish government now has €21.3 billion on deposit with the covered banks.  For most of the previous three years it had hovered close to €3 billion.

The increase is because the government has already received the money for the bank recapitalisation process from the EU/IMF.  Over the coming months this money will be taken off deposit (which the government has to get back) and used as capital (which the government has no guarantee of getting back).

It does seem that the fall in private sector deposits in the covered banks seems to stalled and these deposits actually increased from €106.3 billion to €108.2 billion in April.

Friday, May 27, 2011

Retail Sales slip again

The April Retail Sales Index has been published by the Central Statistics Office.  The volatility that has seen the core series fall, rise, fall, rise over the previous four months continued into April, when March’s rise was followed by a fall in April.

Here is the retail sales index excluding motor trades.

Ex Motor Trades Index to Apr

The gap between the value and volume series has been narrowing in recent months, though this has been driven more by the continued fall in the volume series rather than any significant rise in the value series. 

The volume series has fallen and is now only higher then when the severe weather resulted in a sharp downswing last December.  The value series has performed slightly better and although it is down 2.4% on the year it is still at the same level as was recorded last July.  It should be noted that this has more to do with rising prices than increased spending.

The annual changes reflect these patterns with the annual changes in the volume index falling below the annual changes in the value index.  This has not been a feature of the recession to date that has generally seen the value index fall at a faster rate than the volume index. 

Annual Change Ex Motor Trade Index to Apr

Here are the monthly changes which as stated above have moved from positive to negative for each of the past five months.

Monthly Change Ex Motor Trade Index to Apr

How much do we need? Where can we get it?

This is an revision to the conclusion of a previous post.  The key question is how long can we last using the funds available from the EU/IMF assistance package?  The five elements we need to determine are:

  1. How much money do we need to fund the annual deficits?
  2. How much money do we need to cover the maturing of existing debt?
  3. How much money do we have now?
  4. How much money can we get from the EU/IMF package?
  5. Can we get money from anywhere else?

Now that a consensus has emerged on Ireland’s medium term debt projections the answer to first question can be identified relatively easily.  Between now and the end of 2014 the IMF forecast that the cumulative general government deficits will be €51.5 billion.  The Department of Finance forecast is that they will be €50 billion.

This analysis excludes the bank recapitalisations required after the recent stress tests.  The EU/IMF deal had a €35 billion contingency fund included for the banks, with half coming from the EU/IMF package and half coming from our own resources (NPRF, cash balances).  This will not be used in full and the €20 billion required from the State for the bank recapitalisation will see a further €10 billion removed from the NPRF with the remaining €10 billion coming from the EU/IMF funds.  The money for the bank recapitalisation is available and is not being used in full.

To get a measure of the ongoing cash requirements of the Irish government we can use the Exchequer Deficit as a proxy.  This includes the gap between government revenue and expenditure, debt interest and the annual €3.1 billion repayments on the Promissory Notes.  It excludes some small miscellaneous items which would likely cancel out and also the accrued interest on the Promissory Notes that will become due but will not be paid until into the 2020s.  We will use the forecasts of the Exchequer Deficit provided on the last page of the recent Stability Programme Update.

We also need money to repay the money due on existing debt that will mature over the next few years.  The National Treasury Management Agency provide a useful table in this regard.  From this table we will use the annual totals for maturing government bonds, short term debt and other debt.  We will exclude the assumed maturity profile of retail debt such as Savings Certificates, Savings Bonds, Prize Bonds and Post Office Savings Funds Accounts which have variable amounts and varying or unknown maturities.  The NTMA state that:

For the purposes of constructing an overall maturity profile of the National Debt, it is assumed that 10 per cent of retail debt matures each year for the next five years and 50 per cent in the sixth year.

Using the Exchequer Deficits and Maturity Profile of Existing Debt we can construct the following table.

Funding Requirements

The second last column gives the annual funding requirement for each year and the last column gives the cumulative requirement between now and that date.  To fund the Exchequer Deficits and repay existing debt between now and the end of 2015 we need just over €100 billion.  How much do we have?

At the end of 2010 we had €16,164 million of cash and other liquid assets that was built up by the NTMA in 2008 and 2009.  The EU/IMF package provides €50,000 million of funding for the State.  This €66 billion will bring us to about the middle of 2013.  After that both our cash reserves and the funding from the EU/IMF will have been exhausted and we need €73 billion to get to the end of 2013.

Would there be any more money in the kitty?  After the current round of recapitalisation there will be around €5 billion of non-banking assets in the National Pension Reserve Fund.  See point 2 in this Information Note.  This €5 billion would bring the total up to €71 billion.  With the interest earned on our cash holdings and maybe a reduced interest rate on the EU borrowings it is possible that we would be able to stretch things out as far as the end of 2013.

As we said in the initial post, the start of 2014 is a crucial time when projecting Ireland’s public finances.  On the 15th January 2014, €11,857 million of government bonds are due to mature.  As things stand we will not have the money to repay these bonds. 

If you look at the schedule of outstanding bonds you will see that these bonds have the highest yield.  At the close today (27/05) the yield on these bonds was 13.12%.  The next bond redemption date after that is not until April 2016 when a further €10,168 of bonds mature and these have a current yield of 11.81%.  This is still in the stratosphere but the big problem we face is the €12 billion of bonds due to be repaid at the start of 2014. 

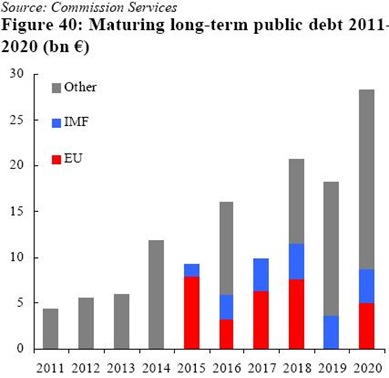
If we get over that we have nearly two and a half years until the next redemption date for government bonds falls due.  However, it should be noted that repayment of the EU/IMF loans is due to begin in 2015 with about €10 billion due as can be seen in this graph from page 38 of a European Commission report from February.

Maturity Profile

In our previous post we suggested that if the €7.5 billion contribution of the EU/IMF to the bank contingency fund that is not being used was redirected to fund the State we could get through the early 2014 squeeze.  This is patently not true.  At current rates our cash balances and the original €50 billion from the EU/IMF will be exhausted in mid-2013.  This extra €7.5 billion would keep us going until the start 2014 but we would not be able to repay the €12 billion of bonds maturing in January of that year.

Of course, there is a lot that can happen in the three years between now and 2014.  The hope is that a lot of the uncertainty that currently shrouds the sustainability of Irish public debt, and also the Irish banks, will have been replaced with a realisation that the situation is difficult but not terminal, and that the domestic economy will have shrugged off the torpor of the exploding property bubble and returned to moderate growth.  By 2014 these are hopes that can be achieved. 

If this comes to pass it is likely we can return to bond markets to raise private funds.  The current plan is that this will begin in mid- to late-2012, but with ten year yields north of 11% it is hard to imagine this coming to pass in that timeframe.  It is possible but I think a timeframe of mid- to late-2013 will be more likely and the numbers above suggest that we can fund ourselves until that time. 

If the additional €7.5 billion was available as a contingency it would add further support to that view.  The consensus view of the DoF, EC and IMF is that the General Government Debt to GDP ratio will peak in 2013 and begin to decline thereafter.  If, by 2013, signs of this are evident rather than projected then it would strengthen the view that the debt is sustainable and the possibility of raising private funds would be increased. 

Proposition for the additional support we need came from the IMF last week.  In a conference call following the release of their latest review of the Irish programme Ajai Chopra said:

“European partners need to make clear that for countries currently with programs there will be the right amount of financing on the right terms and for the right duration to foster success. In other words, the countries cannot do it alone and putting a disproportionate burden of the cost of adjustment on the country may not be economically or politically feasible. The resulting uncertainty affects not only these countries but through the high spreads and lack of market access it increases the threat of spillovers and creates downside risks to the broader euro area. Hence, these costs need to be shared including through additional financing if necessary.”

Of course, there are many potential downsides ready to spring up and undermine the view that we can resume funding ourselves independent of official support.  These uncertainties are manifold and we do not need to revisit them here.  The conclusion here is that the State has funding that can see it through until after the middle of 2013.  Between then and now they key is to restore the credibility that will allow us source funds from that point on private markets.

We started the crisis trying to hide the true extent of the economic catastrophe we faced with claims such as:

We have long passed the point where “others believe in us” and statements such as the above, and many more besides, have completely undermined our credibility.  More recently we have moved to a position where we are much more open and accepting of the huge problems we face.  The Department of Finance is now aligned with the views of the EC and the IMF.  The recent stress tests have earned validity that previous attempts have not.  The external view is that we may still have some skeletons in the closet as has been the case with the now beleaguered Greece. 

However, I think that give or take €5 billion or so (which would be largely down to forecasting difficulties), we have put our problems out in the open.  The true scale of the problems in the public finances and on the balance sheets of the banks is now accepted.  We now need to deal with some domestic overshooting pessimism and external underrunning credibility. 

These are deservedly reflected in the current bond yields.  Over the next 18 months if it can be shown that we have finally gotten a handle on our problems (which I believe we largely have) this pessimism will dissipate and our credibility can be restored.  If we achieve that we can find the €100 billion needed to keep country funded until the end of 2015, and particularly the €20 billion needed for 2014.

The 21 Countries Most Likely to Default

The Atlantic ran a short piece that listed the 21 countries it felt were most likely to default based on the price of Credit Default Swaps (CDS). Why 21?  The published list is in a rather annoying click through format so it is reproduced here.  The numbers give the price of 5-year CDS in basis points.

  1. *Greece, 1393.33
  2. Venezuela, 1026.92
  3. *Portugal, 663.67
  4. *Ireland, 662.83
  5. Argentina, 612.77
  6. Ukraine, 450.02
  7. Lebanon, 359.35
  8. Vietnam, 305.45
  9. *Spain, 275.67
  10. Croatia, 264.83
  11. Hungary, 260.00
  12. Romania, 230.17
  13. Bulgaria ,203.50
  14. Lithuania, 201.50
  15. *Italy, 167.88
  16. Turkey, 164.21
  17. *Belgium, 156.88
  18. Kazakhstan, 151.52
  19. Israel, 147.98
  20. Poland, 140.32
  21. Russia, 136.83

The list is dominated by European countries (in bold) and has six eurozone countries (asterisk).  You may not be able to access CDS markets but maybe you could make some money on this very thin market provided by Intrade.  I would not buy this contract at any price above 5 for 2011.  If a 2013 contract was available the price would have to be below 25.

Unlike the view coming from the CDS market I am not of the opinion that “default is inevitable”.  We are going to need a lot of help, almost all from the EU/IMF package, and a reduced interest rate, an extended repayment schedule , and access to the €15 billion of the €35 billion set aside for the banks that will not be used will be necessary.  If this unused €15 billion could be added to the €50 billion already committed to funding the State then a re-entry to bond markets in mid-2013 would not be required.

At this remove it is impossible to see how we could obtain sustainable interest rates from bond markets.  The 10-year yield on the secondary market is over 11%.

Bond Yields 3M to 27-05-11

The drop in yields that followed the bank stress tests that revealed that €20 billion of the €35 billion contingency fund would be used to recapitalise the banks was short lived.  Yields quickly returned to 10% and have now broken through the 11% barrier.  We could not sustainably borrow money at these rates.

As Prof. Karl Whelan has usefully pointed out the current €50 billion package and the use of our existing cash resources would probably get us towards the end of 2013.  Prof. Whelan concludes:

My conclusions on this are that even an optimistic scenario sees the state requiring additional funding of €11.7 billion over and above the EU-IMF money to finance the state for the next few years. With cash balances apparently dwindling to about €7 billion in a couple of months time, it seems that we may soon be faced with the prospect of either an intensification of fiscal adjustment in an attempt to reduce deficits to fit the size of our funding or else a return to the markets some time during 2013 with no margin for error. An alternative prospect would be to attempt to negotiate a new EU-IMF deal next year that would allow the state to defer a return to the markets.

Going into 2014 we would still have a large, but hopefully declining, annual deficit to fund and on the 15th January we have €11.9 billion of bonds maturing.  After that we do not have any bonds maturing until April 2016.  At 12.97% these bonds had the highest yield of all Irish governments bonds in today’s trading.

If the €15 billion earmarked for the banks could be transferred to the State it would delay the necessity to return to the markets until the middle of 2014.  This is also reported here.  It is probably a little incorrect to say that there is €15 billion of EU/IMF money that will go unused.  Of the original €35 billion contingency fund for the banks €17.5 billion was coming from the EU/IMF and €17.5 billion was coming from our own resources - €10 billion from the NPRF and €7.5 billion from our cash balances.

Now that the final bank recapitalisation will require €20 billion we know it will be €10 billion from the NPRF and €10 from the EU/IMF package.  The €15 billion that is unused is €7.5 billion of our own cash we obviously still have access to and €7.5 billion of EU/IMF money which we are no longer using.  So the actual change to the EU/IMF deal would require €7.5 billion of money to be allocated to funding the State rather than the banks.

If we could get to the middle of 2014 we would be two years from having to rollover any of our existing debt and the requirement for new debt would be substantially reduced, provided we have brought the deficit under control.  At the most we may need to borrow an additional €4 or €5 billion in 2014 if the full €15 billion could be redirected.

I do not think the threat of default is as clear as the above table would indicate.  However, if we are to avoid that in 2014 we do need access to around €20 billion of funding.  It is very hard to imagine that we will be able to obtain that from bond markets.  If we cannot access the funds the outcome will be a default.  This is the outcome that those trying to resolve this crisis are trying to avoid.  In my view there is the capacity to do.

The OECD and Unemployment Assistance

This week the OECD published an update of it’s economic outlook.  The projections for Ireland did not reflect the optimism of College Green earlier in the week.  There was more coverage of a presentation given by the OECD’s Patrick Lenain to the Foundation for Fiscal Studies.  The Irish Independent reported the story as ‘Cut the Dole and get the Jobless back to Work’.  This seems to indicate that one follows the other which is a clear non-sequitur.

The feature of Lenain’s presentation that has garnered most attention is to recommendation to have declining assistance payments to the long-term unemployed.  The slides of Lenain’s presentation can be found here.  This element can be found on slide 32 of the 35 in the presentation. The contents of the slide are reproduced here.

Unemployment benefits (UB): support income without reducing work incentives

  • UB (JA and JB) prevent jobseekers from falling into poverty.
  • But their design implies high replacement rates and work disincentives for low-skilled workers, especially when combined with secondary benefits.
  • In due time, review UB level to reduce risk of unemployment persistence and reduce fiscal cost.
  • Best practices: allow benefits to decline with duration; increase monetary incentives to take up work offers.
  • Return to work is best protection against poverty.

The suggestion is that the “best practice” is that unemployment assistance payments should decline with duration.  The slide indicates that “return to work” is the best protection but it seems to ignore the possibility of returning to work.

In normal labour market conditions there may be some merit in declining unemployment assistance payments, though Irish labour market conditions are distressed rather than normal. 

Here is a graph from Denmark that gives appears to give credence to view.  The Danish system was mentioned in a television discussion of the OECD presentation.  The graph is taken from page 92 of this report (in Danish!).  The graph shows the percentage of unemployed people who return to employment each month.  The green line shows data from 2005 to 2007 when unemployment benefits lasted for four years.

Return to Employment

The graph shows that for all durations of unemployment of between one and four years that about 2% of people return to employment.  It is slightly higher for shorter durations and then declines to the 2% level until it spikes dramatically at four years.  The proportion of people who have been unemployed for four years that return to employed surges to nearly 14% and declines thereafter.  The clear implication is that cutting unemployment benefits encourages people to return to unemployment.

I am not sure that the implication is supported by the evidence.  The graph does highlight that people respond to incentives.  I cannot read the Danish report and it would be interesting to see how many people actually remained unemployed for the full four years.  It may that 14% of people unemployed get a job as soon as the payments expire but this could be 14% of a very small number of people if most people have got a job before the four year deadline is reached.  This is likely true as about 2% of unemployed people at each duration up to four years re-entered employment.   How many would be left after 47 months have passed?

Saturday, May 21, 2011

Medium Term Debt Projections are all the same

We now have updated versions of the medium term projections of the Irish Economy from our own Department of Finance and externally from the European Commission and International Monetary Fund.  The relevant documents are:

Here we will focus on the medium term government debt projections of the three bodies.  The following table gives their General Government Debt (GGD) projections up to 2015.

General Government Debt Projections

It is evident that up to 2013 the forecasts for the three bodies are closely aligned with just 1% between the forecast levels.  Over the next two years, though the forecasts diverge substantially and by 2015 there is a €13 billion gap between the DoF forecast at the lowest level and the IMF forecast at the highest.

What is driving this change?  The next table looks at the forecasts provided for the annual General Government Balance (GGB) over the same period. Note that the 2011 figures exclude the money required for the bank recapitalisations but these are included in the total debt figures above.

The figures in this table represent the gap between government revenue and expenditure that is added to the general government debt.  

General Government Balance Projections

It is is immediately obvious that these figures are very similar right up to 2014.   This is not true for 2015 when the IMF have a forecast GGB of €8 billion as opposed to around €5 billion for the other two organisations.

In fact over the five years from 2011 to 2015, the cumulative general government balances are €55 billion for the DoF, €58 billion for the EC and €60 billion for the IMF (with most of this increase accounted for in the 2015 figure).

Although there is a €13 billion gap between the highest and lowest GGD figures for 2015 there is “only” a €5 billion gap between the highest and lowest cumulative general government balances up to 2015.

The IMF project that funding the government balance from 2012 to 2015 will require €43 billion and they add this full amount to the debt (216 – 173 = 43).  The DoF have a funding requirement of €39 billion for the same period (the difference again mainly being the 2015 figures) and they add €30 billion of this to the debt level (203 – 173 = 30).  It seems the DoF are €9 billion short in their forecast of the debt increase or they are getting €9 billion from somewhere other borrowing to provide the full €39 billion required (30 + 9 = 39).

So have the DoF lost €9 billion of debt?  No, they are using the fact that we had €16 billion of cash we have on deposit at the end of 2010.  See Table 2 in the recent Information Note from the NTMA.  The use of this money will reduce the necessity for borrowing.

The difference between the debt figures is not because of any differing views on the medium term projection of the Irish economy (in fact up to 2014 the projections of all three bodies are virtually identical).  The difference between the figures is down to the treatment of the cash balances we have built up.  The DoF are forecasting that we will use €9 billion of them; the IMF are forecasting that we will use none.  The IMF might have a higher debt figure but in their scenario we will also have higher cash balances.  The net effect is pretty much identical (apart from in 2015).

Of the €13 billion gap in the 2015 debt levels between the DoF and the IMF, €9 billion can be accounted for by the use of cash balances, €3 billion for the difference in the 2015 government balance figure and just €1 billion for differences in the general government balances between 2011 and 2014.

The DoF, EC and IMF debt projections between now and 2014 are very closely aligned (and none of them approach €250 billi0n.)  The projection on this site of a 2015 GGD of €211 billion before the use of cash balances is also consistent with these.

The last thing we’ll look at is why there is a €3 billion difference between the DoF and IMF figures for 2015.  To be fair, projections for five years from now will have a large margin of error but there may be some interest in seeing what factors underlie the difference between the forecasts without necessarily put huge stock in the forecasts themselves.  Then again there may not be, so this is below the fold.

Thursday, May 19, 2011

Quarterly Financial Accounts

The Central Bank has released the Q4 2010 data for its Quarterly Financial Accounts series.  The release is here and the data is here.  The numbers give an insight into the improving balance sheet of the household sector in Ireland.

Household Assets and Liailities

Net financial wealth in the household sector has been increasing since the beginning of 2009 but is largely unchanged from where it was in 2002 when the series begins.  This has been brought about by a combination of increases in financial assets and decreases in financial liabilities.

Although the total amount of financial assets held by households increased from 2002 to 2007, this increase was offset in net financial wealth by a similar increase in liabilities.  The graph below gives the largest of those household financial liabilities: loans.

Household Loans

The total amount of loans owed by households has been falling since end of 2008.  This is the result of a huge slowdown in the drawdown of new loans, particularly mortgages, and repayments of existing loans.  The amount of outstanding loans in the household sectors peaked at €203 billion in Q4 2008.  In the eight quarters since then it has fallen to €186 billion.

At 120% of GDP this is still very high but the data show that it is declining as households undergo significant deleveraging.  The vast majority of this reduction will be the result of loan repayments rather than loan write downs.  Most of the loan write downs applied by the banks to the loans books so far have been as a result of the transfer of their developer loans to NAMA.

Saturday, May 14, 2011

Constantin Gurdgiev on Ireland’s Public Debt

There has been a huge amount of comment on Irish public debt over the past few days.  The debate was raised up a notch by the €250 billion figure that was thrown into the pot by Prof. Morgan Kelly in his most recent article in the Irish Times.  We took that to task here and all our contributions to the public debt debate can be followed here.

On Wednesday night there was a further debate on the National Debt on Tonight with Vincent Browne on TV3.  You can watch the show here and the debt discussion is from the start until about 20 minutes in.  In this piece we focus on the contributions of Dr. Constantin Gurdgiev to the show.  This is not because of any wish to attack Dr. Gurdgiev but rather because his contributions allow us to focus on many of the popular misconceptions that have arisen in the recent debate about our public debt.

To begin let’s reiterate what our projection of the 2015 public debt is:

This means that by the end of 2015 the General Government Debt will be in the region of €205 billion.  As €15 billion of the promissory notes will have been paid out, the total amount actually borrowed will be €190 billion.  These are huge sums of money and puts the country right of the border of sustainability.

As with all projections there is an element of uncertainty involved.  When it comes to projecting Ireland’s future public debt these uncertainties are significant.  When making the above projection we noted that:

There are other issues related to the banking collapse that are not included.  These are the final outcome of the NAMA process, whether the shutdown of Anglo and INBS will require further injections of capital, and how to unwind the €140 billion of liquidity the banks have taken from the European and Irish Central Banks.  There is also the long-term hope that we will be able to sell off our stakes in the two ‘pillar’ banks to recoup some of the money swallowed by the bailout.  There is a great deal of uncertainty about all of these.

Most of these are covered in the commentary that follows.  Anyway on with the show.  Here in a nutshell is what Dr. Gurdgiev said.  Transcripts of the segments that provided these gems are also provided below.

  1. Start with a 2015 public debt prediction of €225 billion from the IMF
  2. Add in €31 billion for NAMA (but the final losses could be more)
  3. Add €16 billion for loan losses in the banks that are not covered by the €24 billion recapitalisation.
  4. Add €4 billion of bank recapitalisation not covered by the State's €20 billion contribution
  5. Add €25 billion as a 16% risk weighting on the central bank liabilities of the banks

This “sound-bite analysis” cannot be countered with simple “sound-bite responses”.  T0 reply to this we need the facts and they need to be provided carefully.  This post is long.  If you want to see a factual presentation of our projected debt position you’re best to go  here rather than plough through this.  If you want to see why the above commentary is wrong read on.

Friday, May 13, 2011

Core inflation continues to rise

The CSO has released the April CPI numbers.  Core inflation, which excludes energy and mortgage interest, moved to +0.66% from +0.23% in March.  The increase in the headline rate moderated in April and the annual inflation rate now stands at +3.3%.

Core Inflation April 11

Wednesday, May 11, 2011

Two Steps to Economic Ruin: Step One

Earlier we focused on the basis for Prof. Morgan Kelly's diagnosis that the country is freefalling into the economic abyss with no hope escape.  We are undoubtedly in a very perilous position but it is not as severe as he has suggested.  One contrast we have noted is that the public debt will be around €200 billion rather than “closer to €250 billion” as he suggested.  In this instance we will look at the proposed prescription. 

National survival requires … … the Government to do two things: disengage from the banks, and bring its budget into balance immediately.

This is utter nonsense.  Earlier in the piece we had been told that the public debt would be €250 billion.  In this instance,  it was suggested that the debt “can be halved to €110 billion by cutting loose the banks”.  There's something not quiet right with the sums here.

Regardless, there is no way we could save €110 billion of debt by handing the banks over to the ECB. We've committed to spending €66 billion in total on the bank bailout so how can we possibly knock €110 billion off our debt by “disengaging from the banks”.   And as around €16 billion will come from the destruction of the money built up in National Pension Reserve Fund during the good times, the amount of debt that we could save is closer to €50 billion.  Still significant but not €110 billion.

So how much could we save?

Monday, May 9, 2011

Getting the Public Debt number is hard

One thing that has continually persisted in this crisis is the inability to be accurate with numbers.  After two days examining public debt figures I was somewhat taken aback to see the following headline in the business section of Saturday’s Irish Examiner.

National debt ‘set to hit €173bn’

All evidence had led me to believe that the General Government Balance at the end of this year would be €159 billion. Until I looked for the source of the story.  The Examiner story comes from this BOI report which states that:

Ireland’s debt ratio is set to rise further, however, and recent developments mean that the debt burden may now peak at a higher level than previously projected, as outlined in a revised Stability programme published recently by the Department of Finance. The Department had expected the debt ratio to rise to 99% this year and to peak at 103% in 2013, but now forecasts 111%, rising to a peak of 118%. In cash terms the debt total is forecast to end the year at €173bn, or €25bn higher than 2010, reflecting the Budget deficit and some €10bn to cover the costs of additional bank recapitalisations.

I have tried to figure out what this is based on and here is the April 2011 Stability Programme Update.  In table 11 on page  26 it does indeed indicate that the GGD will be 111% of 2011 nominal GDP, which is forecast to be €156.1 billion (bottom of page 50). It is true that 111% of €156 billion is €173 billion.

Yet, back last March (only nine weeks ago) the DoF forecast that that the GGD for 2011 would be €159 billion not €173 billion as it seems to now indicate .  See page 2 in this document

So how did the end-2011 debt forecast go from €159 billion to €173 billion in a matter of weeks?  Page 20 of the Stability Programme Update provides the answer.

The requirement for additional capital for the banking sector, arising from the results of the PCAR/PLAR process, was announced on 31 March and this will also impact on the overall Exchequer position in 2011.

The results of that process show that a further €24 billion is required by the banking sector. It should be noted that €5.3 billion of this €24 billion represents a buffer over and above the requirements of the stress test. Moreover €3 billion of this figure will represent contingent capital.

€10 billion of the €24 billion will be provided from the National Pensions Reserve Fund (NPRF) and thereby has no impact on the Exchequer position.

This was already included in the budgetary forecasts published in December 2010. Of the remaining €14 billion that is required, a substantial element will come from the Exchequer but there are a number of mitigating factors - such as burden sharing and capital generating asset disposals - which will help reduce the Exchequer funding requirement and alleviate the burden on the domestic taxpayer. For the purpose of the fiscal and debt projections contained in this Update, it is assumed that Exchequer funding in the order of €10 billion will be required. However, the actual amount to be sourced from the Exchequer will become clearer in the coming months in the context of the amount raised from the mitigating factors.

This clearly indicates that €10 billion will be required from the Exchequer to fund the €24 billion recapitalisation of the banks.  The other €4 billion will come from the sale of Irish Life and haircuts to subordinated bondholders in the banks.  I had previously assumed that half of this €10 billion would be drawn from the existing cash balances of the State and thus would not increase our borrowings.  At the end of March these were €22.4 billion.  As it now seems that we are going to leave these cash balances intact are we going to borrow all the recapitalisation money?

The end-2011 GGD should not have been increased by €14 billion. That is a mistake.  At a maximum it should be increased by €10 billion.  The other €4 billion is a mystery.  This brings our end-2014 debt forecast up to €205 billion but also means we have an extra €5 billion of cash to use.  The effect on the net position is zero.

Here are the DoF projections of the GGD for the next few years.

  • 2011: €173 billion
  • 2012 €190 billion
  • 2013 €198 billion
  • 2014 €202 billion
  • 2015 €203 billion

There are still getting to a total of around €200 billion but in a slightly accelerated fashion.  The €14 billion has no increased the debt beyond the projections we have been using so perhaps it is due to the accelerated drawdown on the EU/IMF funds in 2011.  No additional €4 billion of expenditure has been announced.

No other reason is given for the €14 billion increase in the GGD from €159 billion to €173 billion, yet it is clear that only a maximum of  an additional €10 billion will be borrowed for the €24 billion recapitalisation.  The Department’s documents say as such.  At a time when we are scolding others for incorrect debt estimates (as far away as 2014) it is unusual that we would have to provide a similar scolding to the DoF for estimates that are only seven months from coming to pass but they seem to be more measured when it comes to forecasting the end-2014 debt level.

Sunday, May 8, 2011

Public Debt and Bank Losses: How Much Have We Allowed For?

There has been a huge amount of comment on debts, liabilities and losses in the Irish economy.  The most high profile of the recent estimates has been that the public debt will be “closer to €250 billion” by 2014.  In my view this is an over-estimation and the 2014 public debt is likely to be around €200 billion.   This is not a difference that is “immaterial”.

A story based on the premise that our debt is unsustainable needs a debt figure of €250 billion to remove all doubt that the debt is sustainable.  With a debt of €200 billion the picture is not so clear cut. €200 billion is still a huge burden and is a monumental amount of debt.  The problem for the doomsayers is that it is a debt that the Irish economy may be able to carry. 

There is no certainty either way but with a projected debt level of €200 billion you need to weigh the costs and benefits of a drastic course of action, be that a sovereign default, an immediate budget balance, exit from the EU/IMF package or maybe even all three at once!  A debt of €250 billion would make such cost-benefit analysis largely obsolete because a debt of €250 billion is unsustainable and drastic action would be required.

If the debt is going to be €200 billion then a more considered approach must be taken because the certainty of insolvency is removed.  Thus the difference between a debt of €200 billion and a debt of €250 billion is very much “material”.  Could the debt in 2014 be €250 billion?

At the end of 2011, the internationally recognised measure of public indebtedness, the General Government Debt (GGD) will stand at €159 billion.  After years of fantasy projections that were wide of the mark, it now seems that the Department of Finance has got a handle on estimating the country’s medium-term deficits.  The projections are that for the period 2012 to 2014, the deficits will add about €34 billion to the General Government Debt.  Given the horrendous state of the public finances it is hard to envisage a further deterioration that would see a significant increase in the amount of borrowing required to run our public services, but some slippage is possible.

This will bring the debt to around €195 billion, still €55 billion short of the total required for Armageddon.   As it stands we are told the covered banks will need another €24 billion of capital.  About €20 billion of this will come from the State.  Of this, €10 billion will come from the further decimation of the savings built up in NPRF.  This will not add to our borrowings.  The other €10 billion will come from some of our existing cash balances which again will not increase our borrowings.  It is likely that the amount borrowed for this recapitalisation will bring the 2014 debt to around €200 billion, give or take.

Is there another €50 billion of debt out there to bring about the Day of Judgement?  This debt can only come from losses in the banking sector which has now been umbilically linked to the State.  However, rather than looking for another €50 billion of debt to be created by the banking collapse I think it is worthwhile to look back and see what levels of losses have already been accounted for, and whether it is likely that these are an underestimate of the final loss outcome.

To this end we will just consider two sources of losses.  A more forensic analysis would probably reveal more losses that have been accounted for but we can start with these two processes.

  1. Losses generated by the transfer of developer loans to NAMA and
  2. Losses covered by the most recent set of stress tests on the four “viable” covered banks.

The losses crystallised by the NAMA process are very easy to work out.  By the end of March this year, NAMA had acquired €72.3 billion of loans from the five participating banks (PTSB does not have a developer loan book) and had paid €30.5 billion for them.  Thus, the banks were forced to apply €41.8 billion of losses to their balance sheets.  These losses were covered by the earlier recapitalisations that saw €46 billion committed to the banks.  The borrowing that this required is all included in the €200 billion debt estimate.

So what level of losses was covered by the recent stress tests?  The stress tests looked at the entire loan books of the four banks examined and provided loan loss provisions.  Here are the adverse scenario lifetime loan losses estimated by BlackRock Consultants.  The number in brackets is the percent of the loan book at the end of 2010 that these losses comprise.

  • Residential Mortgages: €16.9 billion (12.0%)
  • Corporate Lending: €2.5 billion (5.8%)
  • Small and Medium Enterprise Lending: €7.0 billion (19.0%)
  • Commercial Real Estate Lending: €10.3 billion (25.5%)
  • Consumer Lending: €3.5 billion (27.1%)
  • TOTAL: €40.1 billion (14.6%)

These are not the only losses covered by the stress tests.  The banks are also being forced to deleverage by selling non-core assets.  This will require the sale of €72.6 billion of at an estimated loss of €13.2 billion.  BlackRock estimate that this loan book would have lifetime losses of €3 billion.  All of these losses are covered by the €24 billion recapitalisation.  Again, the borrowing this €24 billion requires is included in the €200 billion debt estimate.

The reason the required capital is lower than the projected losses is because 1) the banks already have an existing capital stock, 2) the banks had already incorporated some loss provision on their balance sheets and 3) these are lifetime losses some of which can be met by the future operating profits of the banks so the current capital injection covers losses expected to crystallise over the next three years (€27.7 billion). 

So from these two sources we have €41.8 billion of loan losses on the transfer by five banks of their developer loans to NAMA, and €43.1 billion of loans losses included in the stress tests of the four viable banks.  This means that nearly €85 billion of loan losses (and €95 billion of losses in total) have been accounted for in the covered institutions.

There will also be losses in the banks not covered by the guarantee that have been lending into the Irish economy: Ulster Bank, ACC, Rabodirect, Bank of Scotland, etc.  These losses are of little concern to us, but they do increase the amount of losses already accounted for as this huge banking collapse unwinds.  There will also have been other losses in the covered banks that will have been worked through outside of the NAMA and stress test processes. 

This means that the total amount of loan losses already accounted in the system is somewhere in the region of €100 billion.  Is there anyone who has suggested that Irish banking losses will be €150 billion? Anyone?  These are the level of losses that are needed if Ireland’s public debt is to reach €250 billion by 2014. 

This time last year Prof. Morgan Kelly forecast that “between developers, businesses, and personal loans, Irish banks are on track to lose nearly €50 billion if we are optimistic (and more likely closer to €70 billion)”.  Prof. Kelly deserves huge credit for his foresight about these losses in the banks. He would be right about the public debt if he had taken his original figure and pushed it up to €100 billion.

Some estimates of public debt add in some selected liabilities of the banks.  Banks have huge liabilities: depositors, bondholders and central banks.  But the banks also have huge assets: primarily loans.  Data from the Central Bank show that the covered banks had total liabilities of about €430 billion at the end of December 2010.  These liabilities will only become a problem for the State if the €430 billion of assets the banks also have on their balance sheets generate losses that mean the liabilities cannot be met.  These losses are most like to occur in €294 billion of loans to customers that the banks have. Account has already been made for €85 billion of such losses.

The liabilities sometimes also include the €30 billion used to set up NAMA.  Again there is an asset to offset this liability.  What matters for the debt is whether NAMA makes a loss.  NAMA itself forecasts a profit of nearly €1 billion.  This is probably a little optimistic but given current property prices it is likely that NAMA would make a loss of around €3 billion.  The future direction of property prices will dictate the final outcome but it impossible for it to be anything approaching the current liabilities of NAMA.

If Ireland’s public debt is to be €250 billion as forecast by Prof. Kelly, another €50 billion of banking losses have to materialise in the six covered banks.  If Ireland’s public debt is to be €250 billion by 2014 we are bust. 

If these €50 billion of banking losses cannot be found, and Ireland’s public debt in 2014 is going to be closer to €200 billion, then we need a reasoned debate on how to address this huge problem that we face.   I’d like to think that Prof. Kelly is somewhere enjoying the hysterical reaction that his “back of a fag box” analysis has generated.  I’d like to think that the rest of us can realise that it is wrong. 

If someone thinks Ireland’s public debt is going to be €250 billion in 2014 they should tell us how they think this will happen.    The General Government Debt is going to be around €200 billion in 2014.   Of this, we will have brought about quarter of it with us into this crisis, a half will be due to funding the deficits from 2008 to 2014 with only the remaining quarter due to the banking disaster.  Cutting loose the banks could not possibly lead to a situation where “at a stroke, the Irish Government can halve its debt to a survivable €110 billion”.  The banks are not the biggest source of our debt.

We need to move on to that reasoned debate and determine the best course to take in getting out of this huge problem.  This will mean some of the drastic measures listed above should be considered but we are still short of the stage where these are a necessity.  It is still likely that we can survive this crisis. 

Saturday, May 7, 2011

More on the Public Debt

Got up this morning to see that Morgan Kelly has another chilling article in The Irish Times.  It is required reading.  Prof. Kelly is willing to say things that other people are not.  On the whole issue of public debt sustainability, which we looked at recently, he is pretty clear.

Irish insolvency is now less a matter of economics than of arithmetic. If everything goes according to plan, as it always does, Ireland’s government debt will top €190 billion by 2014, with another €45 billion in Nama and €35 billion in bank recapitalisation, for a total of €270 billion, plus whatever losses the Irish Central Bank has made on its emergency lending. Subtracting off the likely value of the banks and Nama assets, Namawinelake (by far the best source on the Irish economy) reckons our final debt will be about €220 billion, and I think it will be closer to €250 billion, but these differences are immaterial: either way we are talking of a Government debt that is more than €120,000 per worker, or 60 per cent larger than GNP.

I tend to be with Namawinelake on this one.  I’d like to know how the €250 billion of debt is expected to materialise.  If this comes to pass (and Prof. Kelly has some previous on this) then the country will be insolvent.  There is no doubt about that.  However, in my view the total debt by 2014 will be closer to €200 billion.  This figure puts us on the border of insolvency but it is not one that makes default “inevitable”.

The €220 billion estimate from Namawinelake is from this comment in February and is reproduced here.  At least this provides some details to work from.

As regards government debt in 2014, for the time being I will go with the government’s own deficit projections (€43bn 2011-2014) though the balance of opinion seems to be that GDP growth will be less than official projections. I believe the Promissory notes will need be drawn down sooner rather than later and not in an even 10-years but frankly this is all tinkering around the edges. The real question is what will happen with ECB operations that see €100bn in our banks at present, how long can this emergency funding continue (it started in Sept 2008 in earnest) and will part of that end up on the national debt?

So general govt debt of €148bn in 2010 + €43bn deficit 2011-2014 + additional capital for banks (€35bn earmarked of which €25bn is described as a contingency) + debt redemption nil (rollover) + NAMA €45bn (€40bn bonds including pyt for sub-€20m exposures and €5bn development debt) + swapping of ECB/CBI ELA for national debt x,

So €271bn + x for ECB/CBI ELA swap for general government debt.

Obviously NAMA will have some value as will ELA and we start off with some funds in the NTMA/NPRF so the net will be less than that , but I would have said €220bn as a rough ballpark.

There is not a lot wrong with this analysis. Since February we have learned that developer loans of less than €20 million will not be transferred to NAMA.  Of course, this doesn’t eliminate the losses it just makes the potential NAMA losses a little smaller.  It makes the potential bank losses bigger by the same amount, but we now know that the banks will require €24 billion to cover these losses and become “over-capitalised” rather than the  full €35 billion of the contingency fund that was used in the debt estimate above.

This will bring the €220 billion debt estimate for 2014 down to below €210 billion and not too far from what we have forecast.  Of course, even that estimate is plagued with uncertainty as we have recently noted.

There are other issues related to the banking collapse that are not included.  These are the final outcome of the NAMA process, whether the shutdown of Anglo and INBS will require further injections of capital, and how to unwind the €140 billion of liquidity the banks have taken from the European and Irish Central Banks.  There is also the long-term hope that we will be able to sell off our stakes in the two ‘pillar’ banks to recoup some of the money swallowed by the bailout.  There is a great deal of uncertainty about all of these.

An extreme negative outcome an any of these could bring the debt level close to Prof. Kelly’s prediction of €250 billion.  It would be nice if he had told us which of these he expects to go south.  There are four items listed above and it might be easier to bet on one unspecified loser than try to find four winners but I’m willing with the following:

  • Namawinelake’s estimate that NAMA is currently nursing losses of around 11% on the loans it has obtained based on the site’s NWL Index.  The index “is about NAMA breaking even” and I’m not exactly sure how to translate this into a monetary loss, but NAMA has paid €30.5 billion for the loans it acquired.  This would indicate a loss of around €3.5 billion.
  • The Central Bank’s belief that Anglo and INBS will not require any additional capital from the State. If they do there are some senior bondholders left that have to be first in the burden-sharing line.
  • That the central bank liquidity can we wound down over time.  Should we be looking to end a situation that has our banks getting €80 billion from the ECB at the extraordinary low rate of 1.25% and a further €65 billion from the Central Bank of Ireland at around 3.00%, which itself is also from the ECB?  This is a huge implicit subsidy for the banks and, by association, us.
  • We can forget about selling the so-called “pillar” banks in the timeframe considered. We may be able to do so at some stage in the future but this does not enter into the medium-term sustainability analysis.

If all of these come to pass we can expect the 2014 debt level to be in the region around €205 billion.  If nominal GDP by 2014 got to €170 billion then the debt/GDP ratio would be around 120%.   The design of the Promissory Notes means that the amount of cash we will have had to borrow will be around €18 billion less, bringing the debt that we will actually have to pay interest on to around 108% of GDP and we would have to commit around 5% of GDP per annum to interest costs.  As I said here.

There remain some significant uncertainties that may force a restructuring regardless, but based on what we now know I think we can survive without a default/restructure. The decision may be made to take this option anyway and if the benefits of doing so exceed the costs then the view that the debt is “sustainable” is moot.

Friday, May 6, 2011

Irish Examiner Article 06/05/2011

I had a piece carried today by The Irish Examiner on Ireland’s recent trade performance.

Trade Is Keeping Our Economy Afloat

I’m not sure the piece fully agrees with the headline!  The piece is a slimmed down version of an original article that is included below the fold.  This also includes a number of additional details that also belie the above headline.

The main point is that while the headline trade figures appear to give support to the concept of an ‘export-led recovery’, I think that once you dig down into the figures in a little more detail the impact of these trade improvements ‘on the ground’ is negligible.  

The Exchequer Balance

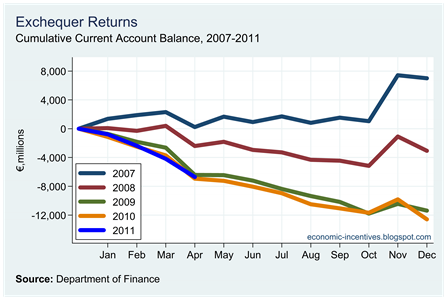
Here are the cumulative monthly Exchequer Balances from 2007 to 2011.  The running deficit of €9.9 billion this year is the worst yet!

Exchequer Balance 2011

The Information Note from the Department tells us that everything is ok because this is in line with expectations.

The Exchequer deficit at end-April 2011 was €9.9 billion compared to a deficit of just under €7 billion in the first four months of 2010 and was in line with Department of Finance expectations. The Department will continue to monitor the emerging data closely and will present a view on the likely outturn for the year as a whole at the mid-year Exchequer Returns Press Conference in early July.

The year-on-year increase in the deficit of just under €3 billion was primarily due to the €3,060 million in non-voted capital expenditure payments to Anglo Irish Bank and INBS in March which relate to the first instalment of the Promissory Notes committed to these institutions in 2010.

Ah, it’s all Anglo’s fault!  If we just look at the Current Account Balance we can get a picture of the day-to-day accounts of the government.  We have already looked at the revenue side and saw that the story was not as rosy as it was made out to be.  It’s a bit of a waste of time looking at the expenditure figures in the Exchequer Account because of the nonsense that is “net voted expenditure”.  Anyway here are the current accounts balances going back to 2007.

Current Account Balance

This is much better. Things are only equally as bad as they were last year!  We must be due to turn that corner soon.  Not quite.  Although looking at the current balance does net out the effects of “appropriations in aid” and “net voted expenditure” it can’t account for things that are left out of the Exchequer Account altogether.

Here are the Debt Interest costs incurred over the past four years.

Cumulative Interest

For a country accumulating debt at the rate we are it is remarkable that the 2011 interest cost is so close to the 2010 cost.  What is even more remarkable is how low the interest bill was in the first two months of the year – practically zero.  We were paying interest during this time but not from the Exchequer Account.  Again the Information Note provides the answer.

Total debt servicing expenditure in the first four months of the year, including funds used from the Capital Services Redemption Account (CSRA) – which do not impact the Exchequer – was €2.7 billion. Adjusting for the sinking fund payment which had been made by end-April in 2010 but which has not yet been made in 2011, debt servicing costs in the first four months of 2010 were just over €1.8 billion. The large year-on-year increase in debt servicing expenditure reflects the cost of servicing a higher debt burden.

If the true debt interest costs were included in the Exchequer Account then the Current Account Balance would not be close to last year’s level it would be about €0.7 billion worse!

Public Debt Sums: Past and Future

At the end of 2007 Ireland’s General Government Debt (GGD) was €47 billion, which in itself is a huge amount of money but when compared to the size economy it was relatively small.  By the end of this year, the GGD will be a staggering €159 billion and will be over 100% of GDP. 

It is these numbers that have brought the concepts of ‘default’ and ‘restructuring’ to the fore.  The view here is that default is not inevitable.  Here we work through the €112 billion increase over the past four years and what is likely to happen to the debt over the next four.  Where will we be in 2015 and can we survive? The answers are a debt ratio of around 108% of GDP and probably yes.

Read on to find out why.

Thursday, May 5, 2011

April Exchequer Returns: Illusion and Reality

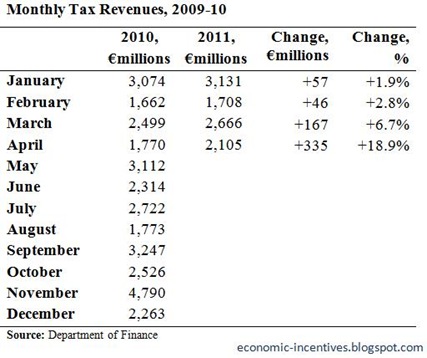
We now have the Exchequer Returns for the first third of the year.  While things do not appear to be getting worse, it is still clear that there is a way to go before things start getting better.  The public finances are a mess.  Here are the April documents.

As a result of the changes announced in December’s Budget we have to be careful about making direct comparisons between the 2010 and 2011 figures.  As it stands tax revenue is now 6.7% up on 2010.

Cumulative Tax Revenue to April

Tax revenue is up just over €600 million on last year but most of this can be attributed to a “bump” in April.  It is not clear that this will be maintained and the DoF Information Note suggests that some of this can be attributed to the early receipt of DIRT payments.

Monthly Tax Revenues to April

We can get a better picture if we look at the changes by the main tax headings.

Monthly Tax Revenues to April

The increase, such that it it, is entirely due to the 20% increase in Income Tax collected.    The first thing to note is that some of this is not actually an increase at all, just a reclassification. 

In the Budget the previous Income and Health Levies were replaced by the Universal Social Charge (USC).  While the Income Levy was included under Income Tax, the Health Levy was actually an “appropriation-in-aid” for the Department of Health and Children and did not enter the Exchequer Account. 

Money raised by the Health Levy went directly to the Department.   In 2010, the Health Levy generated €2,018 million in revenue.  It is likely that at least  €400 million of that would have been collected by April.  Under the USC this money now enters the Exchequer Account.  A substantial portion of the increase in Income Tax is due to this.

There also appears to be some timing issues with DIRT with about €120 million paid earlier than expected.  We can expect subsequent Income Tax receipts to be lower because of this.  The DoF Information Note does provide one year-on-year comparison that can be made.

PAYE receipts show the impact of the Budget 2011 income tax measures but as they do not include receipts from the USC, they allow for a comparable year-on-year analysis to be made. PAYE receipts in the first four months of the year amounted to €2.8 billion, a 4.9% increase on the same period in 2010.

It would be good if the Department provided the breakdown of Income Tax revenue that they obviously have but they give us this little titbit.  This suggests that PAYE receipts are up about €130 million on the year.  This is not because of any labour market or employment improvements.

In last December’s Budget, tax credits were reduced to bring more people into the tax net and tax bands were reduced so that people begin to pay the top rate of 41% at a lower level.   All told these changes were expected to bring in over €850 million in extra revenue in 2011.  It is pretty much a guess on my part as we do not know how much of this €850 million would derive from the PAYE sector, but I would guess that after a third of the year it would be more than €130 million.

I think it is pretty clear that once we account for the reclassification of Health Levy receipts, the once-off bounce in DIRT receipts and the expected changes in tax credits and bands that Income Tax is performing worse than it was last year and that any rise in receipts is illusory rather than reality.

Wednesday, May 4, 2011

Consumption – Income and Credit

We have considered the change in consumption recently. See here.  Consumption in 2010 was down nearly 12% on the level recorded in 2007.  A key issue surrounding this is whether this is a demand problem – that is, is consumption down because demand is down?

As we saw, up to 2009, demand as measured by net disposable income only experienced a slight fall.  Here is the same graph.

Household Expenditure

It is clear that a large gap emerged between income and consumption in 2009.  In 2009 when net disposable income fell by €2 billion, consumption fell by around €10 billion. Even in 2008 it is evident that consumption expenditure was flattening out as net disposable income was still rising.  We do not have the 2010 figures yet.  For further details of the data to 2009 see here.

Here is a graph using the Credit, Money and Banking Statistics of the Central Bank.  It should monthly transactions for household consumer credit since 2005.  Positive numbers indicate that consumer credit expanded with negative numbers indicating a contraction.

Household Loans for Consumption (Transactions)

Since the start of 2009 consumer credit has fallen (repayments on existing debt exceeded new loans forwarded) for every month except June 2009.  Of course, this is a combination of households’ reluctance to demand credit and the banks’ reluctance to supply it.

Since January 2009 the amount of consumer credit extended to households declined from €29 billion to €18 billion.

Household Loans for Consumption

The jump in the series at the start of 2009 is because the country’s 400 credit unions were added to the Money, Credit and Banking Statistics.    The series was levelling off in 2008 and since 2009 has fallen almost every month.

Irish Government Bonds

We have looked at the ownership of bank bonds a number of times using the data compiled by the Central Bank.  Over on irisheconomy.ie, Prof. Karl Whelan gives a useful summary of some of the problems that arise when interpreting this data (Who Owns Senior Irish Bank Bonds?).  We examined some of this issues here.

A similar, and now very much related question, is who owns Irish government bonds?  As with the bank bonds this is generally a difficult question to answer.  According to the NTMA there are €89.5 billion of Irish government bonds outstanding.

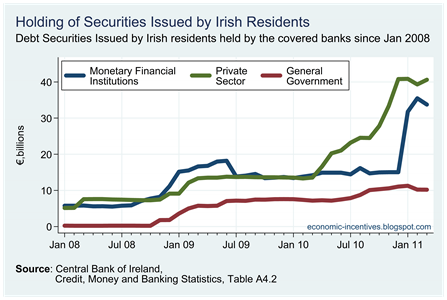
We can get a partial insight into these from the Central Bank’s Money, Credit and Banking Statistics.   Although much of the focus has been on the liability side of the balance sheets of the covered banks, here we look at the assets.  We have previously looked at this graph here and here.

Irish Securities held by Covered Banks

The green line representing “private sector” bonds is actually mainly those issued to the banks by the National Asset Management Agency (NAMA) in return for the €71 billion of developer loans.  The promissory notes are not in this graph.  They are considered a loan to government.  Details of them can also be found in the “Loans to Irish Residents” graph here.

The blue line for monetary financial institutions is largely the covered banks themselves.  As the posts above point out they didn’t get a huge appetite for bonds in each with the vertical rise in January of this year.  This increase was due to banks holding bonds in themselves.  These “self-held” bonds were issued for three months but it looks like they are being renewed rather than retired.  The remaining €15 billion of bonds from Irish monetary financial institutions remains noteworthy.

Of central interest here is the line showing the holdings of the covered banks of bonds issued by the Irish government.  This is now just over €10 billion.  The covered banks hold about one-eight of Irish government bonds.

Should they hold more?  It might seem unusual to suggest this at a time when a sovereign default is considered “inevitable” by some.  As we saw recently Irish bond yields soared a few weeks ago and the 10-year yield has remained around 10.5%.  A higher yield means a lower price.

Debt total and ratios are usually calculated on the face or nominal value of the debt instrument in issue.  This can be different from the market value.  Although Ireland has nearly €90 billion of bonds outstanding the market value of these is lower.  If the entire market was liquidated it might be possible to buy all this for €80 billion, or maybe €75 billion, or maybe lower.  Is there any convenient way of knowing what the aggregate market value of Irish bonds are?

Anyway, should we not encourage the banks to buy more of these bonds and prices below the nominal value.  In fact, should the country not be doing it?  The NPRF still has around €10 billion in assets that haven’t been used to recapitalise the banks.  The NTMA also has €22 billion of cash in various accounts. 

Why not use some of this money to buy Irish government debt now at reduced prices instead of waiting until maturity and having to repay the full amount?  It would offer a better return than pouring it into the banks!

Printfriendly