Tuesday, October 29, 2013

Retail sales get stuck

The CSO have published the September update of the Retail Sales Index.  Excluding the motor trades, the volume index was unchanged in the month with the value index showing a slight decline.  The increases seen during the sunny summer have not been sustained into the autumn.

Ex Motor Trades Index to Sep 2013

In annual terms, the 2013 figures are now coming up against the short-lived increase that occurred from June to October 2012 (in part driven by the digital switchover for television signals).  This has brought the annual change back towards zero and negative annual changes are likely for the next few months.

Annual Change Ex Motor Trade Index to Sep 2013

A continued drop in the value series will have consequences for VAT receipts.  Finally here are the monthly changes in both series.

Monthly Change Ex Motor Trade Index to Sep 2013

Monday, October 28, 2013

Loans to Customers in the Covered Banks

A recent post looked at the state of the banks and in aggregate showed that the “Irish-headquartered banks” (AIB, BOI and PTSB) had €214 billion of loans to customers against which they had made €28 billion of provisions giving the €186 billion balance-sheet value for their loan books. 

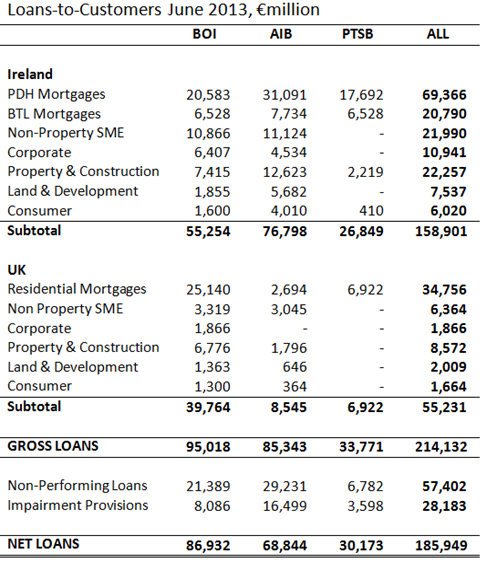
The following table provides some insight by bank, sector and country on the aggregate figures looked at earlier.

Loans to Customers

It can be seen that about a quarter of the loans the banks have are in the UK, and these loans are performing much better than those in Ireland.  The NPL rate in the UK is around 7% (€4 billion out of €55 billion) while the NPL rate in Ireland is around 33% (€54 billion out of €159 billion).  It should be noted that the banks use slightly different definitions of non-performing or impaired loans.

How large will the ultimate losses on these loans be?  Impossible to say.  What we can say is that the covered banks have a lending exposure in Ireland of around €160 billion.  Of this nearly €60 billion is already impaired and the banks have made provisions for an average loss rate of around 50% on those loans.  That seems conservative but there may be losses above that (and also the amount of NPLs continues to rise).

For example, AIB is still carrying a €18 billion exposure to land, property and construction related lending in Ireland. Only €3.2 billion of that is rated as “satisfactory” with €13.1 billion impaired.  AIB also has €11 billion of non-property SME lending but this is similarly tied to property through hotels, pubs and other trading premises. 

Of the €16.5 billion of provisions AIB has against its loans, €7.8 billion are for loans to the property and construction sector while €3.3 billion are for non-property SME lending.  One concern may be that these are not large enough and another is that AIB may not have made sufficient provisions against other parts of its loan book, particularly Irish mortgages.

PTSB have also made provision of about 50% against their NPLs but the main problem there is the €14.3 billion of Irish and €6.5 billion of UK “tracker” rate mortgages it has.  This are a huge drag on any return to sustainable operating profitability though.

In general though, there does not seem to too many skeletons left to unearth in the loan books of the covered banks.  The ECB stress test will see some digging around but it is hard to see anything new been unearthed. Dealing with the nearly €60 billion of non-performing loans we can see are problems enough.

Wednesday, October 23, 2013

Alcohol Prices – Ireland is 2nd highest in EU

A minimum price for alcohol in Ireland remains on the agenda (though it’s legality is still uncertain).  Data from Eurostat show that Ireland already has the second highest price for alcohol in the EU – at more the 60% higher than the EU average.

Alcohol prices

The latest data from Eurostat is for 2012 and is available here.

Tuesday, October 22, 2013

The State of the Banks

The quarterly IMF Reports generated as part of the EU/IMF programme now include an useful table that summarises the state of the “Irish-headquartered banks” (known as “covered” before the withdrawal of the ELG).  The banks included, and their level of state ownership, are:

  • Allied Irish Banks (as merged with EBS) – 99.8%
  • Bank of Ireland – 15.1%
  • Permanent TSB – 99.2%

The most recent review, the eleventh, includes the table aggregating the results of the three banks on page 43. First is the Profit and Loss Account:

Banks P&L

One important measure of the state of the banks is pre-provision profits.  For the past few years the banks have not been able to generate enough income to cover their operating expenses.  Regardless of loan losses that is unsustainable.  The March 2011 PCAR projected that the banks would make €3.9 billion of operating profits in the three years from 2011 and 2013.  This was a wild over-estimate. 

Compared to the first half of 2012, the banks managed to slightly increase their net interest margin (from 1.6% of total average assets, TAA, to 2.1% of TAA).  A small turnaround in trading gains and a reduction in operating expenses from €2.1 billion in H1 2012 to €1.8 billion in H1 2013 resulted in pre-provision profits swinging around from –€0.7 billion to +€0.1 billion.  This is still well shy of what was envisaged under the PCAR.

Although the banks returned a small aggregate pre-provision profit in H2 2013 continued loan loss provisions mean that net income remains negative.  If the level of non-performing loans (NPLs) continues to rise the banks will have to continue provisioning for losses which will continue to be a drag on the P&L account.

Next up is the balance sheet where we will ultimately see the effect of these provisions.

Banks BS

The balance sheets of the banks are getting smaller.  Total assets dropped €40 billion over the year, falling from €322 billion last year to €288 billion at the end of June this year.  Only ‘securities and derivatives’ showed an increase on the asset side, possibly down to valuation effects. All other asset categories fell with net loans dropping by €22 billion.

On the liability side the bulk of the reduction was seen in the money ‘due to Eurosytem’ which fell by nearly 50% over the year.  The other drop was in ‘Debt and derivatives’.  Both interbank deposits and customer deposits rose over the year.  The €3.6 billion rise in customer deposits must be tempered against the fact that government deposits in the covered banks increased by around €10 billion over the year as the NTNA placed around half of the €25 billion cash reserve that has been accumulated with them.

The net equity in the banks (difference between assets and liabilities) was just over €20 billion.  The value of the liabilities is easy to determine; the value of the assets is less immutable. 

As shown, the banks had €65 billion of debt securities at the end of H1 2013.  These are mainly NAMA bonds, Irish government bonds and bonds from each other.  “Oh what a tangled web we weave, when we practice to deceive” (Walter Scott).

The loan books of the banks continue to both decline and deteriorate.  As good loans are paid off the relative size of the defaulting loans increases.  This is a chart on SME lending up to the end of 2012 from the Central Bank’s Macro-Financial Review.

SME Lending MFR

The proportion of impaired loans has risen to around 25% but the amount of lending outstanding has fallen from €60 billion to €43 billion.   For Q1 2011, 15% of €60 billion is €9 billion; for Q4 2012, 25% of €43 billion is €11 billion.  The proportion of impaired loans has increased far more than the amount of impaired loans.  This is not the case in the mortgage market where the level of loan reduction is lower and the increase in impaired loans is faster.  The question of whether the ultimate losses will be above those set out in the 2011 PCAR is still uncertain.

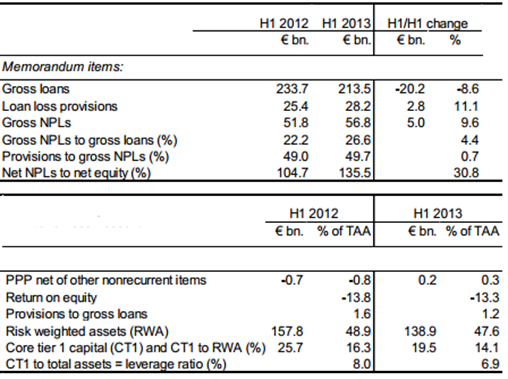
Finally, the IMF include some “memorandum items” that give some further insight into the balance sheet and profit & loss account.

Memorandum items

We see that the banks have a gross loan book of €213.5 billion.  The balance sheet value of €186 billion is as a result of the €28 billion of loan loss provisions that have been set against the loan books.  Non-performing loans in the banks grew another €5 billion over the year but that provisions as a percentage of NPLs is almost 50%.

The second half shows that the banks’ Core tier 1 capital ratio fell from 16% to 14% over the year and is still above regulatory requirements.  Operating losses eating cash and provision reducing the value of loan assets will have eroded the banks’ capital.  A relapse to pre-provision losses and further provisioning on bad loans will erode this further. 

This will arise because additional loans go sour or because they banks may not have set aside enough to cover existing non-performing loans (NPLs).  For example, AIB may not have been conservative enough with provisions against its Irish residential mortgages.  We have seen that AIB has made a provision equal to 34% of its non-performing mortgages, as against 44% for Bank of Ireland and 48% for Permanent TSB.  The banks do have slightly different methods of measuring ‘non-performing’ which may be a factor in the provisions they set aside.

Mortgage Provisions in Covered Banks

So what is the overall state of the banks? Will they pass the forthcoming stress test?  It is likely that the Irish banks will pass the stress test.  Reports suggest that the ECB will require a 7% CT1 ratio in the stress test with a 1% surcharge for “systemically relevant” banks.

The ECB wants to unearth potential risks hidden in banks' balance sheets before banking supervision is centralised under its roof from November 2014 as part of a broader plan for closer European integration to head off future financial crises.

To do that it plans to run an asset quality review (AQR) early next year, for which it will reveal details on Wednesday.

Two sources familiar with the matter told Reuters on Tuesday that the central bank will ask banks to fulfil an 8 percent capital buffer in its review.

The buffer will require a core tier one capital ratio of risk-weighted assets of 7 percent, as foreseen in the final 2019 stage of the Basel III regulatory framework, plus a 1 percent surcharge for systemically relevant banks.

Could the results show that the Irish banks will drop below this level?  It’s possible but unlikely.  The Irish banks must strengthen their operating profitability and will have to continue making provisions against bad loans (but at a much reduced rate) but a drop below the level set out in the ECB stress test is unlikely. 

What could cause the Irish banks’ capital ratios to drop below 8% (in aggregate)?  A further write down in the value of their assets of around €10 billion would probably do it.  This could happen for a number of reasons:

  • If a further €20 billion of loans become non-performing, the current provisioning rate (c. 50%) would knock €10 billion off the book value of the loans.
  • If there was an increase in the provisioning rate against current NPLs from 50% to 66%.  Equivalently, if losses on existing NPLs are crystallised at a level above those currently provided for.
  • If the book value of loss-making, low-interest ‘tracker’ mortgages was reduced (unlikely to be €10 billion though)
  • If the book value of other assets such as Irish government bonds or NAMA bonds was reduced (again unlikely to be €10 billion).

Of course further operating losses and possible changes to the items eligible as Core Tier One Capital will also have a role to play.  The above list are fairly pessimistic scenarios and even if they were to play out (and they are possible) they would still bring the aggregate capital ratio across the banks to around 8% – which is the threshold set by the ECB. 

Under the conditions set out by the ECB no additional capital would be required.  As noted above, the 2011 PCAR was designed around keeping the capital ratios above 10.5% in the base case (and a buffer above that was also provided for). 

If something like the above does play out and the capital ratios in the banks do drop to below 8% where will the money come from to make up the gap?  The shareholder is mainly the State and the amount of subordinated debt in the banks is relatively small (and any write down there would hit the State which holds €1.4 billion of sub-debt between AIB and PTSB).  Similarly there aren’t many senior bonds in issue from the banks.  So where to next?  A depositor haircut a la the botched Cypriot example?

That is very very unlikely in Ireland.  The worst of the banks are now off the stage (Anglo, INBS and Bank of Scotland(Ireland)); the remaining banks are not going to be shutdown.  As projected here the “Irish headquartered banks” probably have around €10 billion of headroom before more capital is required (to stay above the 8% level).  This will be eroded but it will take even larger problems again to generate a hole that has to be filled.  A hole of any substantial size is unlikely but not impossible. 

If it comes to it is there a “National backstop” available?  Yes, the NTMA have accumulated a cash reserve of more than €25 billion.  Using that to recapitalise the banks is an unlikely scenario but the backstop is there.  The Irish banks will pass the ECB stress (and maybe we should be doing more stringent tests of our own) but passing a stress test is not a sign that a bank is healthy.  It just means it’s unlikely to die.  Even when the banks do pass the ECB’s test cleaning up the delinquent loan-book shown on the balance sheet above is a long way from being completed.

Getting to Three Point One

The level of the ‘adjustment package’ in last week’s budget has created some confusion.  The basic sum involves the €1.85 billion of new measures for 2014 announced last week, €0.65 billion of carryover effects (measures which were announced last year but kick-in this year) and €0.6 billion of “additional resources and savings”.  So we have

€1.85bn + €0.65bn + €0.6bn = €3.1bn

The €0.6 billion of “savings” was not set out in the Budget documents but the Minister for Finance has subsequently confirmed it to be €0.2bn from the activities of the NTMA, €0.1bn extra on the Central Bank surplus, €0.15bn due to Live Register “fluctuations” (!), and another €0.15bn arising mainly from state asset transactions.

It is not clear why these items should be counted as adjustments, measures or savings.  It is hard to see how policy changes have impacted them and most are things that would, or should, happen regardless of what was in the Budget.

The new measures in the budget were €0.35bn of net tax measures and €1.5bn of expenditure measures.  There was around €0.65bn of new taxes introduced but some of this was offset by the retention of the special 9% VAT for tourism etc. which cost around €0.3bn.  The tax measures are summarised in Table 7 of the Economic and Fiscal Outlook.

Tax Measures

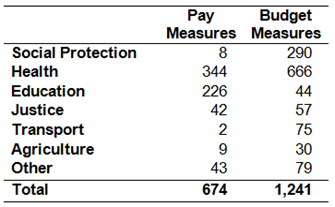
A summary of the €1.5bn of expenditure measures (€1.4bn current and €0.1bn capital) is not provided but it can be quickly extracted from the Expenditure Allocations report.  There are two current expenditure measures we can look at:

  • Central Policy Developments: Pay policy measures
  • Savings measures introduced in 2014 to adhere to the ceiling

The first are the savings that arise from the Haddington Road Agreement brokered between the government and the public sector unions earlier this year and the second are the measures announced in the Budget.  All comprise the adjustment made to current expenditure for 2014 and are summarised here (in €million).

Expenditure Measures

The total of €1.9bn might suggest that there was over-achievement on the expenditure contributions but some of the savings here were used to loosen the pressure elsewhere.  In last year’s budget a ceiling of €49.2bn was set for gross voted current expenditure in 2014.  As a result of decisions taken the ceiling was increased to €49.6bn.  This means some of the savings above were used to fund expenditure elsewhere bringing the net expenditure adjustment to €1.5bn.

For example, Education shows €226 million of pay savings for 2014 but the Department’s pay bill in the Estimates shows a fall of €184 million. The difference is explained by additional staff (mainly teachers and teaching assistants). Staff numbers under the remit of the Department of Education will rise from 94,490 this year to 95,745 in 2014 – an increase of nearly 1,300.  Capital expenditure on education is also set to increase by around €135 million in 2014 – a rise €65 million greater than what was budgeted for last year.

So now it seems we are left with the following budgetary sum.

Total Adjustment

Whatever about their precise nature the €0.6bn of “additional resources and savings” are needed to bring the sum to three point one.

Monday, October 21, 2013

Income and Repayment Stress for Mortgagors and Tenants

The understanding we have of Ireland’s massive mortgage arrears problem remains scant.  Many reasons have been put forward for the continued growth in arrears: unemployment, income decreases, negative equity, regulatory response, lack of repossessions and something called “strategic default”.

Up to recently actual evidence on any of these was absent but this is slowly improving.  In some recent speeches Governor of the Central Bank, Prof. Patrick Honohan has focussed on the role of income in explaining the very high level of mortgage default.  Recently he has said:

“Examination of the Standard Financial Statement (SFS) returns of defaulting borrowers in Ireland has shown that, indeed, monthly amounts due on the original monthly schedule represent a remarkably small portion of current monthly income, for a relatively high fraction of borrowers.”

And back in May he stated:

“The decline in after tax incomes for most employees has been significant, but aggregate data suggest that in the bulk of cases this decline is not so large as to make the continued servicing of debts impossible.  Unless the household was already over-borrowed, a relatively moderate adjustment of spending patterns in response to lower income would allow the average household to remain on track.”

The Central Bank will be formally publishing the results from this research over the coming months.  Here is a table extracted from Eurostat’s results from the Survey of Income and Living Conditions.  It is a measure of housing cost overburden for owners with a mortgage and tenants renting at the market rate:

Housing Cost Overburden

Around one-fifth of tenants renting at the market rate face a housing cost that is greater then 40% of their disposable income.  For occupiers with a mortgage that rate is 3.3%.

The rate for mortgagors is, in proportionate terms, a large increase on the rates of 1.5% and lower that were the case from 2005 to 2007.  However, the increase does not seem sufficiently large to explain why 12.7% of mortgage accounts are now 90 days or more in arrears.

Here is a table that compares gives the comparable housing cost overburdens in EU member states and also provides the proportion of households in each country who are in arrears for either rent or mortgage payments.  Again the data are taken from the EU-SILC.  The numbers in the first two columns represent the percentage of households within each category; the final column is the percentage of all households.

Housing Cost Overburden EU

The first two columns seem to indicate that it is something other than payment to income that explains Ireland’s position at the top of the third column. The proportion of households in Ireland in arrears on rent or mortgage payments is almost three times the EU average and is more than twice the rate it is in all EU countries bar four.

The position of Ireland so low down the first column seems unusual.  How can so few mortgaged households face a housing cost of more than 40% of disposable income?  This is down to the definition of housing costs used in the survey. From this Eurostat publication we can see that it is:

Housing costs include mortgage or housing loans interest payments for owners and rent payments for tenants. Utilities (water, electricity, gas and heating) and any costs related to regular maintenance and structural insurance are likewise included.

Capital repayments on mortgages are excluded as these are considered a form of saving.  Lots of Irish mortgagors may have what appear to be low housing costs because of cheap ‘tracker’ mortgages but they face huge capital payments on an asset that has lost around 50% of its value.  It might be saving in the strictest sense of the word but it would not feel like it to households in deep negative equity.

The proportion of households by country in each category is given in a table below the fold.  This explains why Romania is at the top of the second column and can then end up at the bottom of the third (96% of households are owner-occupiers with no mortgage).

Wednesday, October 16, 2013

Why is the projected budget deficit higher?

Back in April the Department of Finance published the 2013 Stability Programme Update.  In it the projected general government deficit for 2014 was 4.4% of GDP.  This assumed a package of adjustments of €3.1 billion in the Budget. 

Yesterday a package of €2.5 billion of expenditure cuts and tax increases was announced but because of measures put in place earlier in the year (mainly the Haddington Road Agreement) the amount of adjustment for 2014 remains at €3.1 billion.  The Economic and Fiscal Outlook (bottom of page 13) says:

Tax and expenditure consolidation measures of €2.5 billion are complemented with additional resources and savings of some €600 million, giving a total adjustment package of €3.1 billion.

So if the level of adjustment is the same why is it that the projections issued with yesterday’s budget are for a 2014 deficit of 4.8% of GDP.  A comparison of the April and October figures may provide some insight into where the deterioration comes from.

Budget Projections

It is pretty clear why the projected deficit is higher: revenue for 2014 is now expected to be around 1% lower compared to what was set out in April.  Total expenditure is virtually unchanged.

Why is the revenue figure down?  It is mainly because of lower than expected receipts from Income Tax, VAT and Excise Duty.  As described in the notes to the table on page 33 of the Economic and Fiscal Outlook the 2013 outturn for these is set to be around €650 million than was projected even as recently as April.  These lower receipts in 2013 then have knock-on implications for the 2014 projections.

The composition of expenditure appears to have changed since the publication of the April figures but that is largely down to reclassification issues on about €1 billion of expenditure on third-level education.  Free fees (€250 million) and the block grant (€350 million) have been shifted from Other Expenditure to Social Payments and Subsidies respectively, while another €300 million to universities previously under Capital Transfers has also been reclassified to Subsidies.

A notable change in the expenditure list is the increase in Compensation of Employees of €665 million.  There doesn’t appear to be a reclassification item that is responsible for this.  There is also a €490 million fall in the figure for GFCF, though the Exchequer Account figures actually shows a slight rise in 2014 estimate for Gross Voted Capital Expenditure (€3,230 million in the SPU to €3,335 million in the Budget).  Again we may be looking at a reclassification issue but it does not appear to specified.

The Exchequer Account projections in April’s SPU and the Budget’s EFO also show that the deterioration is mainly due to a reduction in revenue forecasts.  In April, Exchequer Tax Revenue for 2014 was put at €40,975 million.  Yesterday a figure of €40,040 million was provided which represents a decrease of nearly €1 billion.

Why is revenue lower than expected? Mainly lower growth, and also lower inflation, than expected. A recent post covered this and the figures for nominal GDP at the bottom of the table above illustrate the problem.  Back in April, NGDP for 2014 was expected to be €174.3 billion.  Just six months later and the figure has been revised down to €170.6 billion.

Ireland collects the equivalent of 30% of GDP in tax revenue.  It’s a bit crude, but 30% of a €3.7 billion reduction in NGDP is roughly €1 billion.  And that is pretty much the reduction that has been applied to the forecast of tax revenue.

If it wasn’t for the accounting chicanery from the Promissory Note swap yesterday’s budget would have meant a 2014 deficit of around 5.4% of GDP.  As the previous post concluded, excluding the largely notional Promissory Note gains (see here) “the numbers [.] suggest that more should be done if the fiscal consolidation plan is to remain “on track” not less.”

Yesterday’s Budget had the full €3.1 billion of adjustments (as confirmed by the Economic and Fiscal Outlook) and the deficit is not falling as fast as planned.  Even if the 4.8% of GDP deficit targeted for 2014 is achieved there is still a significant step to be made to get it under the 3% of GDP limit in 2015 as required under the Excessive Deficit Procedure.  The gamble being taken (again!) is that nominal growth will have resumed by then and will carry most of the burden.  Who wants that bet?

Tuesday, October 15, 2013

Moving to stop “stateless” profits

Included among the budget documents is a short release on Ireland’s International Tax Strategy.  There is not a lot new in it but it does signal that the ability of companies such as Apple to create “stateless” profits or “ocean money” will be curtailed.

The second measure to be included in the Finance Bill is a change to our company residence rules aimed at eliminating mismatches - that can exist between tax treaty partners in certain circumstances – being used to allow companies to be ‘stateless’ in terms of their place of tax residence.

This was signalled here yesterday towards the end of a post on corporation tax:

We are probably not going to hear much at this level of detail in tomorrow’s budget but the Finance Act, 2014 may look to disassociate Ireland from the “ocean money” created by Apple.

No improvement for the household sector

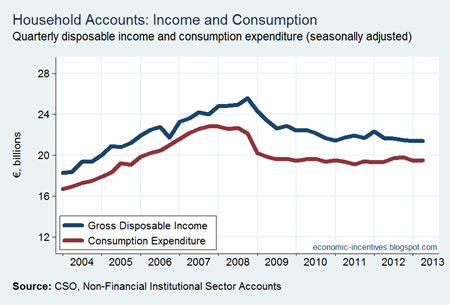
Yesterday the CSO published the Q2 2013 Non-Financial Institutional Sector Accounts.  Here we will focus on the household sector and the main aggregates in H1 2012 and H1 2013.

Household Sector H1 2013

A year-on-year comparison does not show any improvement.  Earnings and social benefits received are down while taxes and social contributions paid are up.  All told, gross disposable income in the first half of 2013 was 3% lower than in the first half of 2013. 

Even though income for the half was down, consumption expenditure held up and rose slightly on 2012.  This means that savings (income not used for consumption) were down.  Savings in the first half of 2013 were around €1.5 billion lower than in 2012.  This will be reflected in reduced deposit accumulation, debt repayments and/or capital investment from the household sector.

The gross savings rate, including an adjustment for the net equity position of pension fund reserves (income earned by pension funds that those not form part of disposable income as it is locked in), fell from near 15% in 2012 to just under 12% this year.

It is has long been expected that a fall in the savings rate would lead to an increase in household consumption expenditure.  In H1 2013 the savings rate fell but consumption did not rise commensurately.  The savings rate fell because households had less disposable income; not because they increased expenditure.

The seasonally adjusted data produced by the CSO highlight this lack of improvement.

Household Accounts

Monday, October 14, 2013

€12 billion in CT revenue?

The issue of Ireland’s corporation tax continues to generate lots of debate.  Whether this is a good thing or a bad thing is also open to debate.  At a recent Oireachtas Committee hearing a question on Ireland’s reputation was put to Prof. Frank Barry of Trinity:

Prof Frank Barry: That is a very interesting question. We speculated for some time about whether the US Senate hearings and reports would cause reputational damage for Ireland. The US newspaper, The Wall Street Journal, has had Ireland in its sights for a long time, complaining about Ireland’s tax regime. I spoke to one of its journalists from the US. It has a stringer in Ireland to whom I often talk, but I was called by a journalist in its US office and had a long chat on precisely this subject. They told me that the sense they were getting from Silicon Valley was that this was doing us no damage whatsoever. I talked with the IDA economists afterwards about this and they said that was exactly what they were hearing as well. That is interesting. I regard the The Wall Street Journal as a hostile source in that sense, so the fact it was saying that was interesting and certainly indicative. Yes, I think we might be over-paranoid here about the possible reputational consequences.

It is hard to know either way.  Moving on.  Yesterday’s Sunday Business Post had an article from David McWilliams on the topic.  It included this assertion:

If these companies were to pay tax at the very low – by international standards – of 12.5 per cent, the exchequer would net Euro 12 billion in corporation tax per year. Euro 12 billion!

[Gated with the SBP but available here.] That is €8 billion more than the c.€4 billion that is currently collected and “these companies” are just the US-owned ones.  The SBP piece is based on a recent article from the Finfacts.ie website.

US company profits per Irish employee at $970,000; Tax paid in Ireland at $25,000

Preliminary data [pdf] from the US Bureau of Economic Analysis (BEA) on majority-owned foreign affiliates of US firms show that in 2010 (latest available), Irish-based firms reported net income of $95.6bn and a payroll count of 98,500 [pdf], which gives profits per employee of $970,000.

And here is where we run into problems.  Depending on the exchange rate used that gives something around €75 billion of profits just from the US companies operating in Ireland.  If we add in Irish companies and non-US foreign companies we can see that the overall amount of profit reported in Ireland could be expected to be well in excess of the above €75 billion figure.  Is it?

We can use the Annual Statistical Report from the Revenue Commissioners to find the amount of business profit that is declared in Ireland for tax purposes.  In the 2010 report it was €70.8 billion.  And here is a table from this post that shows how the €70.8 billion of gross profit is translated into the €4.2 billion of corporation tax that was paid.

Corporation Tax Deductions

The table also shows that the effective tax rate on the €41.2 billion of “Taxable Income” in 2010 was 10.3%.  So what happened to all the profits that the US-owned “Irish-based firms” are making? 

It is not the case that US-owned firms are massively under-reporting their profits from their Irish subsidiaries to the Revenue Commissioners; it is more the case that the profits from these companies are not resident in Ireland for tax purposes.  The problem is down to the definition one uses for “Irish-based”.

For individuals, the US tax system recognises someone as being liable for US income taxes if they hold a US passport.  That is, it doesn’t matter where they live or where they work, as long as they have a US passport they are liable for US income tax, with offsetting credits received for the tax they pay where they live.  [For a discussion of this and recent changes brought in through the FATCA see this BBC article.]

For companies, US residency rules are also based on paperwork rather than activity.  Under US law, the tax-residence of a company is the country where it is incorporated (i.e. what country’s ‘passport’ does it carry).  All companies registered in Ireland are thus considered “Irish-based” under US law.

Ireland is similar in many respects but we have a slightly more intricate approach when it comes to determining corporate tax residency.  Historically, the rule was (from revenue.ie):

All companies whose central management and control is exercised in Ireland (whether it is incorporated in Ireland or not) is regarded as resident in Ireland for tax purposes.

This was revised in the Finance Act, 1999, and now:

in general, companies incorporated in the State are resident in the State.

One of the exceptions to this is:

a company that is ultimately controlled by persons resident in the EU or in a country with which Ireland has concluded a double taxation treaty or is is related to a company the principal class of the shares of which is substantially and regularly traded on one, or more than one, recognized stock exchange in an EU Member State or in a tax treaty country.

Thus, some foreign-owned, Irish-incorporated companies will not be viewed as tax resident in Ireland if they are not centrally managed and controlled here.  Prior to 1999 this was also possible for companies owned by Irish residents but the changes in the Finance Act 1999 tightened up the exceptions to the test of incorporation to foreign-owned companies only.

So what is at play here is that there are Irish-incorporated companies who, for want of a better word, “live” somewhere else.  Just like our income tax system does not levy income tax on Irish nationals who live and earn money abroad, our corporation tax system does not levy corporation tax on (some) Irish corporations who carry out their activities abroad.

There is little that is unique or unusual about this.  The issue is how our rules interact with rules of other jurisdictions, and the US in particular.

When the US Bureau of Economic Analysis says that US-owned, Irish-based companies had nearly $100 billion of profits in 2010 we actually have to go to Hamilton, Bermuda to find a good chunk of it (where Google Ireland Holdings is managed and controlled from) or Cupertino, California (where Apple Operations International is managed and controlled from).

Google Ireland Holdings is tax resident in Bermuda and pays corporation tax there on its massive global profits (the rate of CT in Bermuda is zero by the way).  Apple Operations International is tax resident nowhere and thus pays corporation tax nowhere.  Even though AOI carries out all its activity in the US, it is not resident in the US for tax purposes because it is incorporated in Ireland.  Could Irish emigrants in the US avoid US income taxes because they have an Irish passport not a US one?!? 

Both Google and Apple parent companies are liable for US corporation tax at 35% on their worldwide profits (with offsetting credits given for tax paid elsewhere).  Because of the structure of their businesses and the nature of their profits (passive income generated by intellectual property) they do not have to pay this tax liability until the profits are repatriated to the US.  In the case of Apple the profit is already in the US (and is managed in Reno, Nevada by Braeburn Capital) but because it is controlled by Irish-incorporated AOI it is still deemed “offshore”.

Google’s ability to shift profits to Bermuda where it has no activity or real presence is questionable and needs to be curbed; Apple’s ability to declare profits as tax resident nowhere is just wrong and needs to be stopped. Unilateral action by Ireland is unlikely to achieve either objective.

The OECD’s BEPS initiative may make some inroads in limiting the ability of companies to shift profits to no-tax, no-activity jurisdictions such as Bermuda.  This might impact the scheme used by Google.  The arrangement used by Apple is a bit more clear cut – companies should be tax resident somewhere.  Sinn Fein’s Pearse Doherty has made proposals in this vein over the past few months – that Irish-incorporated companies can only be non-resident here for tax purposes as long as they are tax resident somewhere else, even if that is no-tax Bermuda. 

We are probably not going to hear much at this level of detail in tomorrow’s budget but the Finance Act, 2014 may look to disassociate Ireland from the “ocean money” created by Apple.  How might Apple respond?  A likely response would be to move the management and control of AOI to Hamilton, Bermuda (which requires no more than a post-box) and do as Google does.  Of course, the US could move to treat AOI as US-resident for tax purposes (it does engage in all of its activities there) as suggested by Sen. Carl Levin back in June but the reaction by the company would probably be the same.

There will be no €12 billion of extra corporate tax revenue for Ireland but hopefully madcap notions that there could be will become a little less frequent.

Saturday, October 12, 2013

Deficit Effect of Recent Budgets

The White Paper with the Estimates of Receipts and Expenditure released at midnight last night shows that in a “do nothing” scenario the Department of Finance estimate that the 2014 general government deficit would be 5.8% of GDP (with the 2013 deficit now projected to be 7.3% of GDP)

In advance of Tuesday’s budget Minister for Finance, Michael Noonan has said that the projected deficit for 2014 will be 4.8% of GDP.  Therefore the projected effect of the measures to be announced on Tuesday is a 1 percentage point of GDP reduction in the deficit. 

How does this compare to recent budgets?

Budget Impacts

The “do nothing” scenario sees the deficit fall from 7.3% of GDP in 2013 to 5.8% of GDP in 2014.  Around three-quarters of the improvement can put down to three factors:

  1. The February 2013 liquidation of the IBRC required a €1.1 billion (0.7% of GDP)  payout under the Eligible Liabilities Guarantee (ELG) which will not happen in 2014.
  2. The 9% temporary VAT rate for the tourism sector introduced in July 2011 automatically expires on the 31st of December 2013.  This will increase VAT receipts by around €360 million (0.2% of GDP).
  3. The full-year roll-out of the Local Property Tax is expected to generate an additional €250 million (0.2% of GDP) of revenue in 2014.

That only leaves 0.4 percentage points of the “do nothing” deficit improvement to possible growth effects (and there are other minor carry-forward effects that kick-in in 2014).

If the deficit outturn for 2014 is the 4.8% of GDP that means a 1.9 percentage point of GDP improvement in the deficit would be required in 2015 to keep in line with the limits set out under the Excessive Deficit Procedure (an EDP limit of 2.9% of GDP has been set for the deficit in 2015). 

Nominal GDP growth in 2015 may be a little faster than in 2014 but probably not by much. The current DoF forecasts is for nominal growth of around 3% in 2014.  If that was repeated in 2015, NGDP in 2015 would be around €175 billion.  The April 2013 SPU forecast was that it would be €182 billion. 

Those figures indicated that with slightly higher nominal GDP growth and a €2 billion package of adjustments in Budget 2015 that the deficit was expected to fall by 2.1 percentage points of GDP.  To get under the 2015 EDP limit that is pretty much what is required. 

However, with lower nominal growth and possibly smaller carryforward effects from next week’s Budget then the level of adjustments necessary to hit the 2015 deficit limit may have to rise above the €2 billion that has been pencilled in.  Reducing the cuts in next week’s budget may merely be delaying for 12 months the effort that has to be put in to bringing the deficit down.  Of course, the growth fairy may arrive over the next 18 months in time for 2015.  Hasn’t a return to growth always just been 18 months away?

Wednesday, October 9, 2013

AROP and VLWI

A quick follow-up chart using Eurostat data on at-risk-of-poverty rates and very-low work intensity and again highlights Ireland as an outlier.  The data are from here.

AROP versus VLWI

The vertical axis gives the percentage point impact that social transfers have on the at-risk-of-poverty rate (equivalised income less than 60% of the median). 

In 2011, the pre-transfer AROP rate in Ireland was 39.6%, by far the highest in the EU28.  The post-transfer position reduced the AROP rate to 15.2%.  The 24.1 percentage point improvement is represented by the vertical axis.

The horizontal axis is the proportion of people aged under 60 who live in households with very-low work intensity (those aged 18 to 60 work less than 20% of the available time).  This simply repeats what was shown in the previous post.

The other 27 countries are in a fairly close group between 5 and 15 on both axes.  The pointed labelled ‘HR’ is the newly-accessed Croatia.  Ireland has by far the highest level of very-low work intensity and has by far the most impactful transfer system in reducing at-risk-of-poverty rates.

Tuesday, October 8, 2013

At-risk-of-poverty or social exclusion

Eurostat has a release out today with some regional indicators of employment, population and social exclusion.  The indicator of social exclusion is drawn from three measures:

  • The at-risk-of-poverty rate
  • Proportion of people who are severely materially deprived
  • Proportion of people under 60 who live in households with very-low work intensity

The figure published by Eurostat give the percentage of the population who fall into at least one of the above categories.  The 2011 figure for Ireland is 29.4% which is well above the EU28 average of 24.3%.  Of the countries in the Euro area only Greece fares worse.

However, it is worth breaking down the overall figure into its constituent parts.  The at-risk-of-poverty rate is the proportion of the population with an equivalised income (i.e. after controlling for household size) of less than 60% the median income.  The rate in Ireland is around 16% which compares reasonably favourable to an EU28 rate of 17%.

The rate of severe material deprivation is the proportion of the population who cannot afford at least four of the following:

  1. to pay rent/mortgage or utility bills on time
  2. to keep home adequately warm,
  3. to face unexpected expenses,
  4. to eat meat, fish or a protein equivalent every second day,
  5. a one week holiday away from home,
  6. a car,
  7. a washing machine,
  8. a colour TV,
  9. a telephone (including mobile phone)

The rate in Ireland is around 7.5% compared to an EU28 rate of 9.0%.  So for both the at-risk-of-poverty rate and the severe-material-deprivation rate Ireland is a little below the EU average.  So why then do we fare so badly on the combined measure of at-risk-of-poverty or social exclusion?  It is all down to the final component – very-low work intensity.

This measures the proportion of the population aged under 60 who live in households where the adults (those aged 18 to 59) work less than 20% of the available time.  For a single person that would be working less than 2.5 months in the year.  On this measure Ireland is almost “off the scales” as shown in this chart from Eurostat.  Click to enlarge.

People_(less_than_60)_living_in_households_with_very_low_work_intensity,_2010_and_2011_(%)

Until the recent accession of Croatia, Ireland’s rate of very-low work intensity was around ten percentage points higher than the second highest rate.  It is this measure of social exclusion rather than at-risk-of-poverty rates that explains Ireland’s poor position in the aggregate measure reported today by Eurostat.

Monday, October 7, 2013

Alternatives to the Guarantee – again!

An article by Donal Donovan in last Saturday’s Irish Times reiterates a point made previously that the almost-blanket two-year guarantee introduced for the six Irish banks in September 2008 was the “least-worst option”.

Careful examination of all the possibilities available at the time leads one to conclude, as did the Honohan and Nyberg reports (and my recent book jointly authored with Antoin Murphy), that some form of comprehensive guarantee could not have been avoided – it was the least worst alternative.

I think a careful reading of the Honohan and Nyberg reports is that once all other alternatives had been eliminated the only remaining option was a comprehensive guarantee.  Much of their respective discussions focus on the reasoning, or lack thereof, that led to the exclusion of possible alternatives.

What were the alternatives?  We previously looked at some of these around the time of the first ‘Anglo Tapes’.  Combining the reports of Honohan and Nyberg with the note from Merrill Lynch given to the government on the night of the guarantee provides the following list:

  • Guarantee of all existing liabilities (blanket)
  • Guarantee of some existing liabilities (partial)
  • Guarantee of new liabilities
  • Put failed banks into resolution/liquidation
  • Consolidation of banks through mergers
  • Nationalisation of distressed banks
  • Put distressed banks into protective custody through preference shares
  • Split distressed banks into good banks/bad banks
  • Offer immediate liquidity through a Secured Lending Scheme (SLS)
  • Offer immediate liquidity through Emergency Liquidity Assistance (ELA)

Some consideration was given to most of these but the latter nine were eliminated for one reason or another.  The Merrill Lynch report at the time and the Honohan and Nyberg reports in retrospect all favoured the immediate provision of liquidity to the banks who needed it. Merrill Lynch began the conclusion of their report with:

The extension of a discreet liquidity advance is important to stabilise Anglo [and possibly INBS] and avoid contagion risk.

However, it was decided that liquidity would not be provided from either the assets of the NTMA or the money-creating facilities at the Central Bank of Ireland.  Here is Nyberg on this decision (paragraph 4.7.8):

The policy decision not to use such alternative funding seems to have been based on judgment rather than on an externally imposed limitation. Had the authorities or the Government wished to avoid immediately providing a broad guarantee, some of these funding options were available though, perhaps, not easily. Buying time, even until following week-end, would not have been an idle exercise. It would have allowed the authorities the opportunity to assess more extensively the advantages and disadvantages of the alternative approaches available.  The issue of urgently scrutinising and possibly nationalising certain banks could have been considered, including the option of splitting off their bad assets into variously managed nonbank vehicles (for which funding would have had to be found). There would perhaps have been some scope for discussing and streamlining policy alternatives more intensively with euro area partners. In the best case scenario, there could have been sufficient time to allow for the emergence of an initial common EU approach to the crisis. High priority could even have been given to urgently pursuing legislation covering a special resolution regime, thereby expanding the options available for addressing the fallout from a potentially insolvent financial institution.

And similarly Honohan (paragraph 8.51):

In addition to influencing financial stability policy, a key role of the Central Bank in a crisis is to ensure adequate provision of liquidity. It was prepared on the night of 29/30 September to extend a modest amount of ELA, but not enough to ensure that Anglo would get through the week. Thus back-up liquidity provision was instead hastily secured from the two largest commercial banks, and, crucially, backed by Government guarantee. In effect, the commercial banks were stepping in to provide the lender of last resort facility – which of course was in their own interest to do. The reluctance to deploy more significant ELA facilities from the Central Bank is open to question: such facilities were being used elsewhere and too much was likely made of the reputational risks involved (especially given that the guarantee was about to be announced). It is unlikely that even extensive use of the facility to buy time to facilitate nationalisation the following weekend would have been viewed negatively by partner central banks under the circumstances. While use of ELA would only have been a temporary solution, it might have bought some breathing space while other possibilities were being explored to address the unprecedented situation that many – not only in Ireland – were facing.

So the decision not to provide immediate liquidity was a “judgement” that was “open to question”.  Not exactly ringing endorsements of the path actually taken.  It was the refusal to provide liquidity that made a guarantee all but inevitable.  And as was discussed in the previous post Anglo did not look for the guarantee in September 2008; they just wanted liquidity to keep the doors open.

Of course, it is possible that providing liquidity would have made little difference to the final outcome but it should not be viewed through a lens of “there was no alternative”.  Both Honohan and Nyberg allude to “buying time” or “breathing space”. 

Although reference is made to possible solutions at EU level it is clear that none was envisaged by the government on the night the guarantee decision was made.  In fact, in a Seanad debate on the emergency legislation for the guarantee that took place on the Wednesday morning, Minister for Finance, Brian Lenihan said:

As far as Europe is concerned, and I am a strong European who is proud of our participation in the euro, we were on our own last Monday evening. People are complaining that only six institutions are covered by the proposed measure. The six institutions in question would have been orphans in the world if the sovereign Irish State had not supported them last Monday evening. All the other institutions which want recognition have other sovereigns behind them, some of which are much bigger and more powerful than this State. We had six institutions which had no one to turn to but the sovereign Irish State.

The timestamp on the transcript shows that this was said just before 5am.  But a lack of European support on the night in question is not sufficient to justify the two-year guarantee enacted.  It was too late in Ireland’s case as policy here became locked in because of the guarantee but the European response did come just 12 days later at an EU summit in Brussels.  At this summit it was decided, among other things, that the central banks would provide liquidity to banks that needed it.

Ensuring appropriate liquidity conditions for financial institutions.

6) We welcome the recent decision by the European Central Bank and other Central Banks in the world to cut their interest rates.

7) We also welcome the decisions by the European Central Bank to improve the conditions for the refinancing of banks and to provide more longer term funding. We look forward to Central Banks considering all ways and means to react flexibly to the current market environment.

We welcome the intention of the ECB and the Eurosystem to react flexibly to the current market environment, in particular in considering to further improve its collateral framework with regard to the eligibility of commercial paper.

So if banks needed liquidity the ECB was prepared to relax its collateral rules and provide the liquidity through the ECB’s refinancing operations.  If that failed, ELA through the national central bank remained an option.  Although it happened much later, the case of the Cypriot banks has shown that the ECB will make liquidity available in almost all circumstances.

It must be remembered though that regardless of what was done the dye was set by the end of September 2008.  The banks were bust and there was nothing that could have been done to prevent a hugely expensive banking crisis.  However, any possible incremental cost of the guarantee should not be discounted because it is small relative to the overall fiscal cost of the banking crisis. 

If the two-year near-blanket guarantee had not been implemented how much would have been saved?  That is an impossible question to answer as it is not a case of reducing costs but of redistributing them, and different courses of action may result in higher or lower overall costs to be distributed. 

So far the State has provided €64 billion to our delinquent banks.  The rescue, and associated costs, of AIB, BOI, EBS and PTSB were always going to be undertaken.  The question is the rescue of Anglo and INBS which has an estimated cost of €35 billion.  Patrick Honohan is clear that this should not have happened (albeit under the proviso of knowing what we know now) in  footnote 18 of this speech.

It would have been better had Anglo and INBS been put into resolution as soon as it became clear that their capital was going to be wiped-out by unavoidable losses on developer loans. This should have been evident before September 2008, but was not, leading the Government of the day to include these two failed entities in its blanket guarantee.

Was it clear to anyone that Anglo and INBS were going to have their capital wiped out?  Morgan Kelly said so in public and someone in the Department of Finance thought so in private.  At a meeting that took place “about” the 25th September the then Secretary-General of the Department of Finance, David Doyle is recorded as noting:

“that Government would need a good idea of the potential loss exposures within Anglo and INBS - on some assumptions INBS could be €2 billion after capital and Anglo could be €8.5 billion.”

The ‘Anglo Tapes’ have also shown that Merrill Lynch were in favour of some form of shut-down of Anglo.  This was said by Anglo CEO, David Drumm on the 15th of December 2008:

“It’s Merrill’s. And according to, erm, Alan Dukes today, the government ignored Merrill's advice and didn't shut us.  You know, they wanted us nationalised. 'Just take them off the field, they're a basket case.' And ignored the advice and said: 'No. We want, we want to see if we can get the banks through this.”

It is not clear when or how this advice was given or if the proposal would have resulted in any reduction of the fiscal cost of the Anglo bailout.  The point is merely to show that the solvency of the banks was been discussed and that they were some participants who were of the view that Anglo was beyond redemption.  Of course, this was also the time that David Drumm was talking of a bond buyback in Anglo that he said would generate €9 billion in savings.  It not clear how this would work or how it would fit in with the guarantee.

Merrill Lynch might have advised that Anglo was a “basket case” before December 2008 but two months later PwC presented a report to the Department of Finance which concluded that Anglo was sound and would continue to remain so:

“Under the PwC highest stress scenario, Anglo’s core equity and tier 1 ratios are projected to exceed regulatory minima (Tier 1 – 4%) at 30 September 2010 after taking account of operating profits and stressed impairments.”

It seems to have been a case that advice to cover all viewpoints was available and it was simply a matter of picking the one that best fitted the narrative one was trying to sell or the one that tied in with a policy that had become locked in.

The September 2008 guarantee did increase the fiscal cost of the banking crisis.  On this the Honohan report (paragraph 8.39) says :

The scope of the Irish guarantee was exceptionally broad. Not only did it cover all deposits, including corporate and even interbank deposits, as well as certain asset-backed bonds (―covered bonds‖) and senior debt it also included, as noted already, certain subordinated debt. The inclusion of existing long-term bonds and some subordinated debt (which, as part of the capital structure of a bank is intended to act as a buffer against losses) was not necessary in order to protect the immediate liquidity position. These investments were in effect locked-in. Their inclusion complicated eventual loss allocation and resolution options

With paragraph 8.50 going further on the issue of subordinated debt:

The inclusion of subordinated debt in the guarantee is not easy to defend against criticism. The arguments that were made in favour of this coverage seem weak: And it lacked precedents in other countries (although subordinated debt holders of some other banks since rescued abroad have in effect been made whole by the rescue method employed). Inclusion of this debt limited the range of loss-sharing resolution options in subsequent months, and likely increased the potential share of the total losses borne by the State.

Although it should be pointed of the €12.2 billion of dated subordinated debt covered by the guarantee only €1.4 billion matured during the period of the guarantee, none of which was in Anglo.  The cost of including subordinated debt in the guarantee was, in the broad scheme of things, relatively small.

By September 2008, a banking crisis with massive costs was inevitable.  The guarantee worked in one sense (kept the banking system open) and failed in another (limited ultimate loss allocation after equity to the State).  Could the final fiscal have been lower under an alternative to the guarantee?  Possibly.  The issue is not so much the amounts (which are impossible to ascertain) but more that the guarantee decision cannot be discounted because “there was no alternative”.

There were alternatives and getting a better insight into why they were rejected is important both for understanding the past and preparing for the future (both here and elsewhere).  Of course, it is probably more important to understand why the main banks started, and were allowed to continue, chasing Anglo from around 2002 which in the words of one AIB executive had “joined us for breakfast but now they’re eating our lunch”.  There is some talk of a banking inquiry but we appear to be no nearer a concerted effort to find the answers to these questions.

Printfriendly