Friday, May 31, 2013

To tax or not to tax

The corporation tax debate goes on – and rightly so.  This is a very important issue.  It is important for Ireland; it is important globally; and, of course, it is important for the companies.

One of the problems with the domestic debate is that it is almost completely inward focussed.  It is pretty obvious that such a dependence on FDI is a significant threat to the domestic economy.  Of course, it is also an opportunity if it can be expanded.  It may be a misinterpretation but the Chinese word for “crisis” is commonly cited as being a combination of “danger” and “opportunity”.

So where are the dangers?  The lead story in today’s Irish Times suggests that they are very much domestic in origin and has a set of “effective tax rates” for a group of companies

“including US software company Novell, which paid no tax on Irish profits of $315.6 million in the 16 months to March 2012.”

The company must sell a lot of software infrastructure in Ireland to generate that level of “Irish profits”.  Novell also featured in the Irish Times Top 1000 companies recently.  The details are here.  The figures are notably different.  The turnover figure doesn’t even match the profit figure given above.

It is likely that the figures in today’s report are for a Novell company registered in Ireland but one that is not deemed tax resident in Ireland.  This distinction is not unusual or unique. 

Yesterday, The Guardian ran a significant piece on Apple featuring details on Apple Operations International (AOI) and some links to an Irish employee.  AOI featured in the recent Senate report on Apple.  The section on AOI is very instructive and is below the fold.  If you read it look for indications that this company should be liable for tax in Ireland and compare that to the number of indications that the company should pay tax somewhere else.

Thursday, May 30, 2013

Divergent trends in employee numbers

Yesterday the CSO published their latest update of the Earnings and Labour Costs Survey.  Using complementary results from the Quarterly National Household Survey the CSO provide some details of employee numbers by sector.

The figures exclude the Agriculture, forestry and fishing sector and  by definition excludes all people classified as self-employed.  The figures are number of employees rather than people at work so a person with two jobs would be counted twice.

The pattern for total employees presents a familiar pattern.  There was rapid decline in 2008 and 2009 which moderated in 2010 and the total has been going nowhere since the beginning of 2011.

Total Employees

However, if we get a public/private decomposition of the total since the levelling off at the start of 2011 then a slightly divergent picture emerges. 

Public and Private Employees

Although the total has remained around the same the number of public sector employees has fallen from 409,000 to 384,000 while the number of private sector employees has increased from 1,107,000 to 1,144,000.  The fall in private sector employees has been offset by the rise in private sector employees.

The public sector includes civil servants, public servants, contract and agency staff with public bodies and employees of commercial and non-commercial semi-state bodies.  The figures are done on a headcount rather than full-time equivalent basis and peaked at 427,000 at the end of 2008.

The figure indicate that there has been a rise of around 35,000 in the number of private sector employees over the past three years.  It would be ideal if a further breakdown of full-time/part-time was provided for the public and private sectors.  The QNHS does provide figures for full-time/part-time employment but it does not provide a public/private sector breakdown (and also includes the self-employed as well as employees). 

A quick glance at the most recent QNHS release (Table 1a) shows the total number of people in employment (employees and self-employed) remaining relatively steady over the past two years but that a fall in full-time employment has been offset by a rise in part-time employment.  Given the partially overlapping and partially different coverage of the series it is difficult to establish exactly what is going on.  It could be that there is a reduction in full-time employment in the public sector and an increase in part-time employment in the private sector.  The figures from the CSO do not fully confirm this though.

We can say that the number of employees has been increasing in the private sector.  We can also see that the number of employees in the public sector has been decreasing.  The rise in the private sector is negligible compared to the fall that came before it but it is a small move in the right direction nonetheless.

Wednesday, May 29, 2013

Evening Echo 27/05/2013

The importance of Apple to Cork city and surrounds meant the furore of last week was bound to attract the attention of the local media.  Here is a piece (continued below the fold) on Apple and the broader corporation tax debate that was carried in Monday’s Evening Echo.

Firms using US tax rules to their benefit

The intense focus this week on the tax strategies of US companies like Apple has led to speculation that there will be changes in international tax practices.

This is particularly important from a Cork perspective as not only is Apple based here but so too are many US companies in the pharmaceutical sector. These are large companies offering thousands of well-paid jobs that are hugely important for the Cork region.

There is no doubt there are some risks to having this dependence on US investment but the presence of two construction cranes in Hollyhill is an indication that Apple are not expecting any changes in the medium term.

There have been accusations that Ireland is using unfair tax competition and dodgy tax practices to attract foreign direct investment. However, most of the large companies that the IDA has attracted to Ireland are from the US. This would suggest that there is something in particular that makes Ireland attractive to US companies.

Tim Cook talks special tax deals

Apple CEO has given a wide-ranging interview to the AllthingsD.com website (part of the Dow Jones Company).  In the ten-minute segment below he reflects on his recent appearance before the US Senate Permanent Sub-Committee on Investigations on Apple’s tax strategies.

About 5:25 into the video he says:

“I’ve seen something in the press that says that some people think that we have a deal with the Irish, a special deal with the Irish government, to pay two per cent flat tax rate.  We have no special deal with the Irish government that gives us a two per cent flat tax rate.  So let me just set that aside.”

One wonders why he didn’t say that in response to a direct question on the alleged 2% rate from Senator Claire McCaskill at last week’s hearing.  Bit late now.

Friday, May 24, 2013

How does Elppa reduce its tax rate to just 0.125%?

US company Elppa operates in the consumer gadgets sector.  It has distribution and retail units for its gadgets in countries all around the world.  It also has a single holding company that licenses the design, software and overall intellectual property that go into its gadgets.

By dint of the design of its transfer pricing structure, Elppa’s holding company is ten times more profitable than the retail divisions.  Its sales operations in Ireland contribute 1% of its global profits (excluding the US).

Elppa’s Irish distribution and retail business generates an annual profit of €20 million.  On this it pays €2.5 million in corporate income tax (12.5% of €20 million).  Across all its distribution and retail operations Elppa has global retail profits of €2 billion.  As these individual retail units are a ‘permanent establishment’ in each country the appropriate amount of corporate income tax is paid in each country in which these retail profits are generated. 

Elppa’s holding company generates annual profits of €20 billion.  The company was registered and established in Ireland but it is based in the US. Most of its small staff are in the US, its operational activities are carried out in the US, its board meetings take place in the US and its assets (massive cash reserves) are held in the US.  Apart from its incorporation the holding company has no direct links with Ireland.

In Irish tax law companies that are incorporated in Ireland are considered tax resident in Ireland with some exceptions.  One exception is based on the standard rules produced by the OECD for tax residence based on the test of a company’s ‘effective management and control’.  Elppa’s holding company is effectively managed and controlled in the US.

If a foreign-owned company with a presence of substance in Ireland has a subsidiary that is incorporated in Ireland but effectively managed and controlled in another country that subsidiary is not considered tax resident in Ireland.  There is nothing unique or unusual about this.

As the holding company is incorporated in Ireland it is subject to Irish corporation tax on its source profits generated in Ireland.  Through its activities with the Irish retail division the holding company generates a profit of €200 million.  The holding company will pay €25 million (12.5% of €200 million) on these profits.  The remaining €19.8 billion of profits will be taxed where the company is tax resident.

This is where Elppa makes use of a kink in the interaction between the Irish and US tax codes.  The US tax code treats companies like individuals.  Just as every US citizen is subject to US personal income tax of their global income, every US-incorporated business is subject to US corporate income tax on its global profits.  US-incorporated businesses incur a 35% tax on their global profits (with tax credits given for tax paid elsewhere).

Elppa’s holding company carries out all its operations in the US.  However, because it is incorporated in Ireland it is not considered to be tax resident in the US.  As the holding company has no presence in any other country apart from its incorporation in Ireland and its operations in the US it is deemed to be tax resident in no country.  This is why the scheme works.

The company pays no further tax on the €19.8 billion of profits generated with its retail divisions around the world. 

On a total profit of €20 billion, the holding company has paid €25 million of Irish corporation tax giving an effective tax rate of just 0.125%.

Although it has paid a very small amount of tax the company does have a large outstanding tax liability.  As stated, the US levies a 35% corporation tax on global profits.  Elppa has an international subsidiary that has an annual profit of €20 billion and this will give rise to a tax liability of €7 billion (with a credit given for the small amount of tax paid in Ireland).

Using provisions in the US tax code, Elppa is able to defer the actual payment of this tax liability until the money is repatriated and transferred to a US-incorporated division of the company.  Each year the international holding company generates a €20 billion profit it also accrues a US tax liability of €7 billion.  There is no way for Elppa to avoid this but it can defer the payment of it by keeping the money “offshore”.

It can be seen the Elppa uses two things to defer this tax liability for US corporate tax:

  1. The provision in the US tax code that only US-incorporated companies are considered US-resident for tax purposes.
  2. The provision in the US tax code that allows it to defer the actual payment of the tax liability on the profit earned by the holding company.

Why is Ireland an attractive location for Elppa to base its international operations?

  1. The interaction of the Irish and US tax codes allows companies to take advantage of the above loopholes in US tax law.  We can take it that much of this is the result of deliberate design, definitely in Ireland and possibly in the US.
  2. Ireland is a very small market so the source income it earns in Ireland is very small.  This, allied to our low corporate tax rate, means that Elppa pays a small amount of tax in the international country it chooses to operate in which means that more of its profits can benefit from the scheme outlined above.

Elppa is not avoiding any Irish tax and pays 12.5% tax on both the retail and licensing profit it makes in Ireland. 

It is not avoiding tax in any other international country though the transfer pricing scheme that allows its holding company to be ten times more profitable than its retail divisions can be questioned.  If more profit is shifted to the retail divisions than Elppa will pay more corporate income tax in all the countries in which it operates.  Changes to transfer pricing rules requires international coordination.

Finally, Elppa is deferring the actual payment of a massive amount of US corporation tax but it cannot avoid incurring the liability.

The calculation of a tax rate of 0.125% for Elppa’s holding company is possible but that is only done by taking the tax paid by Elppa on its source profits in Ireland as a proportion of its global profits, most of which are not taxable in Ireland.

[Any similarity to a US consumer gadget company whose name is the reverse of Elppa is purely coincidental.]

Wednesday, May 22, 2013

Who has an effective tax rate of just 2.4%?

In an article by Vincent Browne in today’s Irish Times the following information was presented in bullet-point form on the income tax paid by different income groups:

  • More than half (54 per cent, nearly 1.2 million) of income tax payers earning €30,000 and less have an average gross taxable income of €14,712.
  • Nearly 110,000 earners getting more than €100,000 in gross taxable income have an average income of €183,750, they pay an average of €46,695 in income tax, representing 26 per cent.
  • More than 22,000 earners getting more than €200,000 have gross taxable income of €389,742 on average and pay €108,666 in income tax on average – 28 per cent.
  • The 141 paid more than €2 million a year have an average gross taxable income of €4.1 million. They pay an average of €1.1 million in tax – 27 per cent.

The data used by Browne is from this recent PQ (which can be located now that the excellent KildareStreet.com site is back in action).  Here is the same information provided above in tabular form:

VB Tax Table

The text of the article provides all the information necessary for the table except the average tax paid and the effective tax rate for those with a gross income for income tax purposes of less than €30,000.  Was it space concerns that resulted in these two numbers being omitted?

Using the data in the PQ we can easily work them out.  So for those with a gross income of less than €30,000 we have:

  • Average tax paid: €358
  • Effective tax rate: 2.4%

It is also worth noting that the 54% in this group pay 3.6% of all income tax.  By way of contrast, the 5% of tax cases with incomes over €100,000 pay 43.7% of all income tax.

It is a little incongruous that an article that claims the tax system “zealously protects the wealthy” fails to mention that the effective tax rate on 54% of income tax cases is just 2.4%.  An effective tax rate of 28% on those earning more than €2,000,000 may be low but an effective tax rate of 2.4% on those earning less than €30,000 is incredibly low. 

In both cases the progressive USC and proportional PRSI would have to be included to get the full amount of income-related deductions.  More than two-thirds of the earners in the over €100,000 are non-PAYE earners so they will face the increased rate of 10% on income over €100,000.

The impact of the changes in these deductions introduced since 2008 are explored in this post.  While this post shows that Ireland has the highest level of earned income inequality in the OECD but the most impactful tax and transfer system at reducing inequality in disposable income.  Understanding why there is this large inequality in earned income should be addressed.

The Browne article includes a proposal for “an effective tax rate of 35 per for those earning more than €100,000” which is termed “a modest increase in income tax”.   If applied linearly to the data linked above this would give rise to an increase in income tax of €1.9 billion, bringing the total raised to €13.5 billion.  This is a considerable increase.

As shown above it would impact 108,000 tax cases. Of these, 68,000 have a gross income of between €100,000 and €150,000.  A certain proportion of these will be couples making a joint tax return but let’s ignore that wrinkle for simplicity.

The proposal would increase the average income tax bill for this group from €27,300 to €41,600.  I doubt there is many who would consider a 52% increase in their tax bill as “modest”.  The massive tax increase on this group would give rise to more than half of the improbable €1.9 billion revenue increase from the proposal.

A special rate for Apple?

Much of the focus here on the tax arbitrage strategy of Apple concerns the issue of whether Apple has negotiated a special 2% corporate tax rate in Ireland.  The case study on Apple in the report for Senators Levin and McCain begins:

“The Apple case study examines how Apple Inc., a U.S. corporation, has used a variety of offshore structures, arrangements, and transactions to shift billions of dollars in profits away from the United States and into Ireland, where Apple has negotiated a special corporate tax rate of less than 2%.”

This is based on information provided by Apple to the US Congress Permanent Subcommittee on Investigations.  The information is made available as part of the exhibits for yesterday’s hearing.  The following is on page 65 (of the pdf) based on an exploratory question put to the company by the committee.

4. What factors contribute to Apple's 4% effective tax rate in Ireland?

Due to Ireland’s  overall attractive business environment, Apple has operated in Cork, Ireland since the 1980’s and continues to use Ireland as its principal base of operations in Europe, including for some manufacturing and logistics; sales, accounting and finance; after sales support; and other functions. Apple has grown its operations in Ireland to include approximately 2,700 employees and recently announced Apple's intention t0 add 500 new jobs to the Cork facility and expand Apple's campus with an additional owned building.

Since the early 1990's, the Government of Ireland has calculated Apple's taxable income in such a way as to produce an effective rate in the low single digits, and this is the primary factor that contributed to Apple's rate. The rate has varied from year to year, but since 2003 has been 2% or less. This result is similar to incentives made available by many U.S. states and other countries to entice investment in their jurisdictions.

Nothing about a special rate only a reference to how Apple’s taxable income is calculated.  Nothing about a deal when Apple first came to Ireland in 1980 though the following is an exchange from yesterday’s committee hearing (3:21:20 in the video here).

Sen. McCaskill (D): Let’s assume we simplify this.  Ireland gave you a two percent rate which was negotiated for your company. Correct?

Tim Cook (Apple): We went to Ireland in 1980 and they were very much, I believe, recruiting technology companies at that time.  Apple was a small hundred-million-dollar business that had no operations in Europe. And so as a  part of recruiting us the Irish did give us a tax incentive agreement to enter there and since then we have built up a sizable operation there, nearly 4,000 people; we’re building a new site; we’re continuing to grow…

So there was a “tax incentive agreement” in 1980 but it is not clear what this was.  Back in 1980 Ireland had a dual rate of corporation tax.  That is, there was the standard rate of the tax which at the time was 45%,  but there was also the 10% reduced rate that applied to “manufacturing sectors” (and later some financial services through the creation of the IFSC). 

It is not clear but the application of the lower rate could be the “tax incentive agreement” referred to by Cook.  The lower rate was later abolished following a European Commission ruling that it was a “favourable exemption”. This required a moved to a single rate of corporation tax and the standardisation at the 12.5% rate which only happened in 2003.

Cook does not answer the direct question about the special 2% rate supposedly negotiated for Apple but it is unlikely that such a deal was struck. 

There was, it seems, a change in the early 1990s in how taxable income is calculated but such provisions apply to all companies.   That is not to say that Apple and other companies did not lobby for such a change.  They probably did.  But the implication has been that the “special” rate implies something unique for Apple.  Ireland is not a discriminatory low-tax, business friendly economy.  We’ll be equally business-friendly to any company.  Maybe it is Apple itself that needs to feel “special”.

Anyway, here are the only two construction cranes in Cork.

2013-05-21 10.01.47

Tuesday, May 21, 2013

Transitions in the Income Distribution

Income distribution statistics garner a lot of a attention.  Of the many angles given to them, one is comparisons of the incomes by decile from year to year.  When the CSO first released the detailed results from the 2010 Survey on Income and Living Conditions the following chart attracted a lot of attention.

Figure 1d

The results have since been withdrawn from the CSO and although we have some updated headline results from the 2010 SILC the revised income data by decile has not yet been released.  There are many difficulties in interpreting charts like the above showing income changes by decile apart from actual data errors.  One of the key difficulties is the composition of the people who make up each decile in the annual comparison. 

The same people are not surveyed each year.  A chart showing the annual change in income for the people in each decile over a year would be useful but that is not what the chart above shows.

We don’t have much data on the transitional dynamics through the income distribution in Ireland.  Eurostat provide some insight, albeit with data that is six years old.  Eurostat’s SILC database has a table on such transitions which has data for lots of countries up to 2011 but only features data for Ireland for 2007. 

Here is a table showing the percent of people in each decile who move up, move down or remain in the same decile.

Income Transitions

Overall, less than 40% of people are in the same decile in both years with just over 20% of people in the fourth decile in 2006 remaining there in 2007.  Around 43% of those in the bottom decile had moved up, with most moving up more than one deciles.

Thursday, May 16, 2013

Three approaches to measuring GDP

The three methods to calculating GDP (with links to Eurostat definitions) are:

  1. The output approach
  2. The expenditure approach
  3. The income approach

The figures for each are in the Non-Financial Institutional Sector Accounts publication from the CSO’s National Accounts Section.  In 2011, nominal GDP for Ireland was estimated be to be just under €159 billion.  The following three tables extract the figures (by sector where relevant) from the 2011 ISAs for the three approaches.  Click each to enlarge.

The Output Approach The Expenditure Approach The Income Approach

Friday, May 10, 2013

Migration flows in both directions

Migration estimates from the CSO have been getting a lot of attention this week.  This is perhaps surprising given that they were published more than seven months ago.  The coverage includes headlines like these from the BBC and RTE.

Both of these headlines are wrong and for different reasons.  The 300,000 figure is correct but it does not relate just to Irish people and was not part of the report issued by the National Youth Council of Ireland yesterday.  It is not clear that any of those reporting on the report have actually read it. 

The report is not an estimate of emigration as indicated by the RTE headline.  In fact, the 300,000 figure that has attracted such attention gets a single passing reference in the report (last paragraph of page 13). 

The key contributions of the report are the results of an opinion poll with a 1,000 respondents in Ireland carried out by Red C in October 2012 and a summary of the feedback from 90-minute focus groups of between 7 and 9 Irish emigrants in each of London and Toronto. 

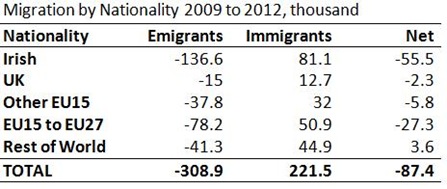
The BBC headline is incorrect because it overstates the number of Irish emigrants over the past four rears by a factor of more than two.  Here is a summary of the migration estimates from the CSO, where the annual data are to the end of April in each year.

Migration by Nationality

The CSO do estimate that 308,900 people have emigrated from Ireland in the past four years but of these 136,600, or 44% were Irish nationals.  On the other side the CSO estimate that 221,500 have immigrated to Ireland over the same time meaning net migration from an outflow of 87,400 over the four years.  For Irish nationals, net migration was an outflow of 55,500 over the four years.

The bad situation for Irish nationals is deteriorating, with almost half of the net outward migration of Irish nationals occurring in the 12 months to April 2012.  This is the opposite pattern for the other large component of the net migration figure, those from the EU accession states in the EU15 to EU27 countries.  For people from these countries, net outward migration has slowed with 70% of the net outflow shown above happening in the first two years, 2009 and 2010.  A table with a breakdown of the data by nationality and year is below the fold.

Thursday, May 9, 2013

Misinterpreting youth unemployment rates

Unemployment rates in the EU27 and EA17 have rightfully being front and centre.  They are unacceptably high.  One sub-category that gets considerable attention is the “Youth Unemployment Rate” for those aged 16 to 24 but it is also one that is subject to significant misinterpretation.  Here is President Higgins at a conference in Trinity College back in January as reported by The Irish Times:

“As President of a country that is a member of the European Union I am so conscious of the discourse that concentrates entirely on the security of the currency, but is happy to leave aside the question of an enormous wedge of the population that are unemployed – 55 per cent of people between 18 and 24 in some countries.”

Some youth unemployment rates are as high as 55% but that does not mean that 55% of people in this group are unemployed.  Unemployment rates are calculated as a percentage of the labour force; not the total population.

Here are the youth unemployment rates in the EU at the end of 2012.

Youth Unemployment Rate

At 27%, Ireland is among the worst performers and the over-50% rates of Spain and Greece are clearly evident.

There are 5.6 million people in the EU27 aged between 16 and 24 who are unemployed leading to the youth unemployment rate of 23%.  Per comments like those from President Higgins this would be interpreted as meaning that almost 1-in-4 people in this age group are unemployed.  Not so. There are 56.7 million people aged between 16 and 24 in the EU.

The youth unemployment rate as a percentage of the total number of people in the age group is 10%.  This is unacceptably high but a rate of 1-in-10 is significantly different to a rate of 1-in-4.  The reason for the difference, of course, is that a huge proportion of young people are not in the labour force – they are in education or training.  In Ireland the proportion of people aged between 16 and 24 who are unemployed is 11%, compared to the unemployment rate of 27%..

Here is a chart that gives the number of 16 to 24 years old who are unemployed as a percentage of the labour force and as a percentage of the population.

Youth Unemployment Rate

It is still an ugly picture with rates for the population measure ranging from 3.8% in Germany to 20.5% in Spain.

Core inflation edges up

Although the overall inflation rate from the April Consumer Price Index was unchanged at 0.5% what we have termed the ‘core’ rate of inflation edged up.  The measure excludes mortgage interest (down 6.8% in the year) and energy products (almost unchanged in the year with a drop of 0.1%).  This represent about 15% of the overall index.  The overall and ‘core’ inflation rates for the past few years have been like this.

Core Inflation April 2013

Although it increased in April, at 0.9% the core rate of inflation is still below the levels it was at for most of the past year.  Finally here is an interesting chart from Danske Bank which compares the Irish Harmonised Index of Consumer Prices (HICP) inflation rate, which also excludes mortgage interest, with the euro area average.

Danske Inflation Chart

Is the household sector balance sheet improving?

The words finally and slowly could be added to the above question but the Q4 2012 Quarterly Financial Accounts released yesterday by the Central Bank suggest that some minor improvements are occurring, though the needle is far from leaving the red zone.  The CB’s data is here and the information release on the Q4 update is here.

On the liability side, household sector loans have been declining since late 2008.

Household Loans

Long-term loans are those that had an original maturity of more than one year.  Since 2008 short-term loans (less than one year maturity or repayable on demand) have declined from €13.4 billion to €6.4 billion.  The €174 billion of outstanding loan liabilities of the household sector is roughly comprised of:

  • Owner-occupied mortgages: €111 billion
  • Buy-to-let mortgages: €31 billion
  • Credit card debt: €3 billion
  • Credit union loans: €6 billion
  • Other consumer debt: €23 billion

These are gross figures and we know that a lot of loans issued during the credit boom will never be repaid in full and dealing with those has been unacceptably slow.  Yesterday’s release indicated that there was €0.4 billion of household loans written off in Q4 2012.   It is not clear where this happened but the sub-prime mortgage lenders which have combusted are a likely candidate.  By September 2011, nearly 60% of the €2 billion of mortgages issued by the sub-prime lenders were already in 90 day arrears.

The primary reason for the reduction in the nominal amount of loan liabilities of the household sector is net loan repayments: repayments on existing loans exceed drawdowns of new loans.  Although total loans have fallen by €30 billion over the past few years this has not translated into an improvement in the usual measures of debt sustainability.  This is because of the drop in household disposable income that occurred over the same period.

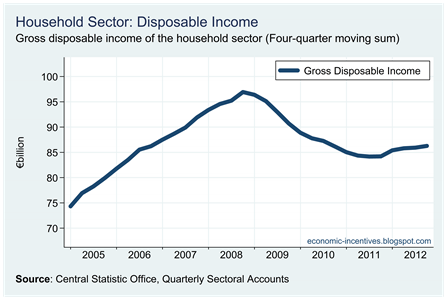
Here is the disposable income of the household sector as measured in the CSO’s Institutional Sector Accounts.   This reflects the household sector as a whole and not simply those carrying the loans shown above.  The income drops in that subset could have been larger or smaller than those shown below.

Household Disposable Income

Anyway, combining the loan and income data gives the following.

Household Debt to Income Ratio

Although, loan liabilities in nominal terms began to fall in late 2008 the debt-to-income ratio continued to rise through 2009 and 2010 and peaked at 222% in the second quarter of 2011.  It has since fallen for six quarters in a row and stood at 202% at the end of 2012.  This is a welcome fall of 20 percentage points but the ratio is still very elevated and has only returned to mid-2006 levels.

The reduction has been helped by the increase in gross disposable income which is measured as:

Self-employed/mixed income + wages + net property income – taxes and social and social contributions + social benefits and other transfers

Here are the figures for the household sector since 2008.

Household Disposable Income 2012

Household income in 2012 was boosted by an almost €2 billion increase in self-employed income, a slight rise in nominal wages while net property income benefitted from the ECB interest rate reductions in late 2011 which reduced the interest paid on loans by more than the interest received on deposits (after the FISIM – Financial Intermediary Services Indirectly Measured – adjustment was made).  The various components of Other transfers (non-life insurance, fines and penalties, inter-household transfers, lotteries etc/) can be read about here (click red right arrow on page to progress).

As well as an increase in the flow of (nominal) income, the stock of wealth in the household sector is also increase.  We have seen the reduction in loans which was the key contributor to the €8 billion reduction in financial liabilities over the year.  Financial assets increased slightly over the year.

Household Financial Assets

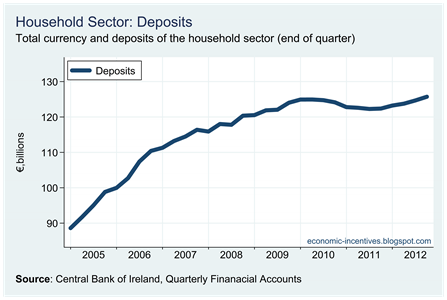
Much of the increase in 2012 is down to the net equity of households in life insurance reserves which increased from €62 billion to €71 billion over the year.  As well as that household deposits have begun to edge up, rising by €3 billion over the year. 

Household Deposits

The Central Bank estimate that the value of housing assets held by the household sector continued to fall in the early part of 2012 but was largely static since then.  Adding the figures for financial assets and housing assets and subtracting financial liabilities gives the following picture for net household wealth.

Household Net Worth

After 17 consecutive quarters of decline, net worth of the household sector has risen in the past two.  Of course, the increase is derisible compared to the collapse which preceded it but it is a move in the right direction.  And it should go without saying that this aggregate analysis of the household sector offers no insight into the huge disparities that exist between the ongoing experiences of individual households.

Friday, May 3, 2013

Household Social Contributions

Following a comment to an earlier post here is a quick table of actual social contributions made by households in the EU.  The data is for 2011 and some countries have missing values. 

This table excludes imputed social contributions which are largely pension contributions made by public sector workers to the government sector.  Public sector workers have deductions described as pension contributions (Irish public sector workers also have a “pension” levy) but these deductions are not used to fund pension benefits; the money is used to fund other current expenditures by government (or alternatively it can be viewed as not being given to the public sector workers in the first place).  Government pensions tend to be funded from current revenue rather than the accumulated savings of pension contributions. 

Anyway here are the actual social contributions made by the household sector across the EU.  The relevance is that the actual contributions made to government are included in Eurostat’s calculation of an implicit tax on labour whereas as contributions made to the private sector are not.  Click to enlarge.

Actual Social Contributions

Here is the proportion of household social contributions paid to the government sector in a selected group of countries.

  • Greece    96.0%
  • Spain    95.7%
  • Austria    94.9%
  • Finland    93.6%
  • France    90.5%
  • Italy    89.9%
  • Belgium    84.4%
  • Germany 82.8%
  • Netherlands 63.5%
  • Ireland    62.9%
  • Sweden    56.9%
  • United Kingdom 53.9%
  • Denmark    12.6%

Thursday, May 2, 2013

Implicit Tax Rate on Labour

Much of the recent emphasis has been on the corporate income tax, but the Eurostat Tax Statistics Annual provides insight on all taxes.  Here are Eurostat’s implicit tax rates on labour for each of the 27 member states in 2011.

PIT ITR

Ireland is right down towards the bottom with the main reason for the difference being the lower rates of social insurance contributions and, in particular, employer social insurance contributions.   The chart offers nothing on the pattern of the implicit tax rate on labour at different wage levels.  Ireland has a very progressive system of Income Tax with low rates (in relative EU terms) on low/middle incomes and average rates and possibly even above average rates (in relative EU terms) on high incomes.  Ireland has low social insurance contributions, employee and especially employer, at all income levels.

The implicit tax rate on labour is explained on page 284 and is summarised in the following box and definition:

Implicit Tax Rate on Labour

The ITR on employed labour is defined as the sum of all direct and indirect taxes and employees' and employers' social contributions levied on employed labour income divided by the total compensation of employees working in the economic territory (see Box F.2).

The ITR on labour is calculated for employed labour only (so excluding the tax burden falling on social transfers, including pensions). Direct taxes are defined as the revenue from personal income tax that can be allocated to labour income. Indirect taxes on labour income, currently applied in some Member States, are taxes such as payroll taxes paid by the employer.

The compensation of employees is defined as total remuneration, in cash or in kind, payable by an employer to an employee in return for work done. It consists of gross wages (in cash or in kind) and thus also the amount paid as social insurance contributions and wage withholding tax. In addition, employers' contributions to social security (including imputed social contributions) as well as to private pensions and related schemes are included. Personal income taxes and social security contributions paid by EU civil servants to the EU Institutions are excluded. Compensation of employees is thus a broad measure of the gross economic income from employment before any charges are withheld.

Wednesday, May 1, 2013

Reasonably strong retail sales?

At the time of Budget 2013 back in December the Department of Finance projections indicated that the Consumption Expenditure component of GDP would decline by 0.5% in real terms in 2013.  The Department has revised their projections in the 2013 Stability Programme Update published yesterday.

On Consumption the SPU (page 12) says :

Consumer spending held up relatively well at the end of last year, and core retail sales have been reasonably strong in the early part of this year. Slightly better-than-assumed labour market conditions and the likelihood of lower-than-anticipated inflation will also support consumption which is now projected to increase by 0.2 per cent.

Have core retail sales been “reasonably strong” to lend support to this revision from –0.5% to +0.2%?  If one looks at the annual changes in the series there does seem to be some support for this.

Annual Change Ex Motor Trade Index

From August 2012 to February 2013 the annual change in both the value and volume of core retail sales was positive, though provisional data indicate that this was reversed in March.  But the series of 12-month changes can obscure what is happening now.  Here are the index values for the series (scaled with January 2010 = 100).

Ex Motor Trades Index

It is clear that the most recent figures are far from cheery.  After been largely flat through 2011 and the start of 2012 core retail sales did show a reasonably strong rise from July to October last year (helped in part by the digital switchover) but have now reversed all of those gains and have shown monthly declines for four of the past five months.  In the first three months of 2013 core retail sales have not been reasonably strong; they have been weak.

The motor trades are excluded from core retail sales but are included in Consumption (c. 4%).  How have they been faring out?

Motor Trades

Down 8% on 2012, though there is the possibility that the new 131/132 license plate system will push more of this year’s sales in the second half of the year.

And finally there is consumption on services.  The is no Retail Sales Index equivalent for services but the CSO have begun producing a Monthly Services Index which looks at all services, rather than just those purchased by consumers.  From that we can extract two series which may be useful here.

  • Accommodation and Food Activities
    • NACE 55 Accommodation
    • NACE 561, 562 Food Services Activities
  • Other Services
    • NACE 68 Real estate activities
    • NACE 92 Gambling and betting activities
    • NACE 93 Sports activities and amusements and recreation activities
    • NACE 95 Repair of computers and personal and household goods
    • NACE 96 Other personal service activities

Services Index

Both are heading in the wrong direction and Other Services are  well below the levels seen at the start of last year, though this didn’t last beyond April.  The volatility also suggests that short-term trends can be quickly reversed.  It should also be noted that these are value or nominal series whereas the discussion up to now as been on volume on real series.  The CSO hope to progress to producing a volume index in the future.  The sample for the services index is also worth noting:

The sample size is approximately 2,100 enterprises. The sample comprises a census of all enterprises with an annual turnover value of more than €20m or enterprises with more than 100 persons engaged. The remainder of the target population is stratified using 2-digit Statistical Classification of Economic Activities in the European Community, i.e. NACE Rev. 2 classifications. Each of these 2-digit NACE sectors are further subdivided into strata based on turnover. A simple random sample is then drawn from each stratum. Retail and Motor Trade figures are taken from the separate Retail Sales Index sample of approximately 1,400 enterprises.

All told, there is little thus far in 2013 to indicate that retail sales have been “reasonably strong”.  Maybe there will be a minor boost from tomorrow’s ECB Governing Council meeting …

Printfriendly