Last week Eurostat published their first estimate of Actual Individual Consumption for 2018. What is unusual about AIC from an Irish perspective is that it is one of the few national accounting aggregates that Ireland comes below the EU average in per capita terms. Here is the volume of AIC per capita in the EU15 countries relative to the aggregate level of the EU15.

There is Ireland down towards the bottom with a level equal to 88 per cent of the outcome for the EU15 as a whole. By this measure Irish per capita consumption of goods and services is below that of Italy.
A further thing worth noting about Ireland’s AIC is how little it has improved relative to the rest of the EU15 during the recovery. The drop after the crash in 2008 is not surprising but, as shown in the chart below, Ireland’s real AIC per capita was 89 per cent of the EU15 level in 2012 and was actually lower in 2018 when it was measured to be 88 per cent of the EU15 level. And this is pretty much where it was back in the late 1990s.

If the recovery is as strong as almost all measures seem to suggest why is it not showing up in real AIC per capita? Here are the components of consumption for a selection of years (again all figures are relative to the EU15 level which is set to 100).

For most of the components Ireland has improved relative to the EU15 level since 2012 including household furnishings (70% to 83%), transport (94% to 102%), communication (91% to 94%), recreation (60% to 72%) and restaurants and hotels (incl. pubs) (134% to 145%).
Of the components going in the other direction, housing shows the largest fall going to 92 per cent of the EU15 level in 2012 to 78 per cent in 2018. And what happens to this component is important as housing is actually the largest component of AIC.
Here are the nominal and real values for each component in aggregate and per capita terms using Eurostat’s price level indices for Ireland in 2018.

The final column gives the share of each component in the aggregate and shows that, at 17.5 per cent of the total, consumption of housing services is the largest component of AIC. This was 21 per cent in 2012. These changes suggest it is worth looking at Ireland’s consumption of housing services.

In the context of real AIC per capita, it can be seen that the housing component rose from 78 per cent of the EU15 level in the mid-1990s to around 95 per cent of the EU15 level just before the crash and the recent relative fall has seen it return to 78 per cent of the EU15 level. Let’s look at some ways to try and explain this.
First, here it is in aggregate terms using constant (2010) prices.

Perhaps surprisingly this shows that our aggregate consumption of housing services has fallen in the past few years and in 2017 was six per cent lower than the level from 2011. In per capita terms, the reduction is also due to the growing population. Compared to 2011, our per capita consumption of housing services is around 10 per cent lower.

Why has our measured level of consumption of housing services fallen? It is hard to know. There has been very limited additions to the housing stock since 2010 but it has not fallen. Here are the gross and net (after depreciation) stocks of dwellings since 2010.

When looking at the consumption of housing we see that, in real terms, there has been a drop in imputed rentals (which are imputed for owner-occupied and vacant dwellings). This has only been partially offset by a rise in actual rentals for dwellings with tenants.

Again, we are left with the question as to why imputed rentals have fallen by ten per cent in real terms since 2011. Yes, some additional units may have become occupied by tenants but, at best, that increase in actual rentals offsets only one-third of the fall in imputed rentals. Where did the housing services we consumed in 2011 that we didn’t consume in 2018 go?
A consequence of this fall is that Ireland now has the lowest real per capita consumption of housing services in the EU15.

There we are, right down at the bottom, only getting ahead of Portugal on alphabetical order. Housing consumption per capita in Italy is almost 40 per cent higher than in Ireland which goes a long way towards explain the relative position of each in the very first table above. If Ireland had Italy’s level of real per capita consumption of housing it would had about six points to Ireland’s figure in the first table of this post.
Here are a couple of outtakes from the SILC that seem to belie our low level of measured housing consumption (with the relative positions of Ireland and Italy worth looking at).

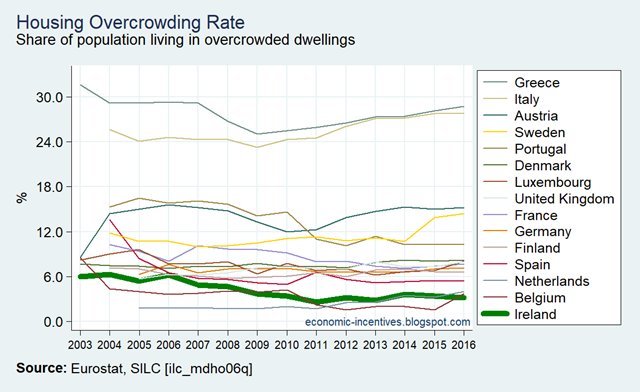

So we have more rooms, less overcrowding and more under-occupied housing then the rest of the EU15. Yes, there is a difference in coverage. These figures are from a survey done at household level rather than the aggregate approach based on the capital stock of dwellings taken for the national accounting statistics.
And it is not necessarily the case that houses represent more housing than other types of dwelling but we have more people living in houses than in any other country in the EU15.

And further we have one of the lowest shares in the EU15 of people experiencing severe housing deprivation (again note position of Italy):

OK, again, these might be measuring different things but it still is somewhat incongruous with our position of having the lowest per capita real consumption of the housing services in the EU15.
There could be lots of things going on (vacancy rates, prices, start point bias etc.) but given that Actual Individual Consumption is potentially a useful national accounts measure, not least because it is not distorted by the activities of MNCs, it would be good to have confidence in it. At present, it says that Italy’s per capita consumption of housing is 40 per higher than Ireland’s which doesn’t instill such confidence.
Tweet
