Wednesday, March 22, 2017

The same but different, somehow

Apple and Samsung have distribution operations who manage the sale of their products to independent retailers in New Zealand.  Here are the aggregate accounts for these operations (for ten years in the case of Apple and seven years for Samsung).

Apple and Samsung New Zealand

Apple’s distribution to New Zealand is through a company that is resident and operated in Australia while Samsung used a branch of an Australian company up to 2013 and since then has used a New Zealand company.  The accounts of these companies and branches are easily accessible from the New Zealand Companies Office.

Apple’s distributor is slightly more profitable but there is little between them.  The average effective tax rates for the two are also very close.  One of these made front-page news; one didn’t.  A year ago we wondered the same for this side of the world.

Monday, March 20, 2017

Why is “arrears capitalisation” so difficult to understand?

The most common mortgage restructure currently used by lenders is “arrears capitalisation”.  Of the 121,000 PDH mortgage accounts that have been restructured, 38,500 have had this restructure applied to them.  It might be the most frequently used but it is also the most misunderstood.  One report states:

Arrears capitalisation, where arrears are added to the principal of the loan, was the most common form of restructure, comprising almost 22 per cent of the total, followed by “split mortgages” at 22.4 per cent, where part of a loan is warehoused for an agreed period.

This is wrong.  Arrears should never be added to the remaining principal.  We pointed this out two years ago but it still persists.  And a large part of the blame rests with the Central Bank.  Footnote 2 of their release says:

Arrears capitalisation is an arrangement whereby some or all of the outstanding arrears are added to the remaining principal balance, to be repaid over the life of the mortgage.

The only way someone can owe more when they miss payments is because of accrued interest; the fact of missing payments or going into arrears does not have an impact on the amount owed.  Adding arrears to the amount owed should never happen.

Consider a simplified situation of a loan for €120,000 to be repaid over 10 years.  To focus on the impact of arrears we will assume that the interest rate is zero.  Adding a positive interest does not change the argument.  So in this no-interest situation 120 payments of €1,000 a month are required to repay the loan over ten years.

Let’s say the borrower makes the payments for three years but then misses payments for an entire year.  The three years of payments (€1,000 x 12 x 3) will have reduced the balance to €84,000 and the year of missed payments will result in €12,000 in arrears.

At the start of year five the borrower is in a position to resume payments and engages with the lender.  The lender tells the borrower that the remaining balance is €84,000 and that there are €12,000 of arrears.  There is no basis for saying that the amount owed is €96,000 or any number other than €84,000.  It is nonsense to suggest so.  The borrower has borrowed €120,000, has repaid €36,000 and therefore owes €84,000.  With zero interest to be added that can only be the amount owed.

What is termed “arrears capitalisation” would actually be better described as “arrears amortisation”.  When the borrower engages with the bank at the start of year five there is a outstanding balance of €84,000 and six years remaining on the life of the loan to repay it.  Resuming payments of €1,000 per month will be insufficient to repay the loan over the remaining term.  Those payments would sum to €72,000 (€1000 x 12 x 6) so the shortfall would be €12,000, i.e. the amount of the arrears.

To ensure that the €12,000 of arrears is repaid over the life of the loan the monthly repayments are recalibrated to take account of the missed payments.  So repaying €84,000 over six years with no interest requires monthly repayments of €1,167.

The monthly repayment has gone up but it is not because any arrears have been added to the balance.  The payment has gone up to ensure that the arrears are paid once, not twice.  Under no circumstances should arrears be added to the balance.  The monthly payments have gone up because the borrower has a shorter period within which to repay the loan.  If the payments weren’t increased there would be a shortfall at the end which, in our simple case with no interest, would be equal to the amount of the missed payments.

In the case of our borrower with a debt of €120,000 the payments made are:

  • 36 x €1,000 for the first three years
  • 12 x zero for the year of missed payments
  • 72 x €1,167 for the remaining six years of the term.

The total amount repaid is €120,000.  If the arrears has been added on the total amount repaid would have been €132,000.  And if the borrower has missed two years of payments the total would have been €144,000.  How can the act of missing payments increase the amount that is owed?  Only interest can do that.

With an “arrears capitalisation” the payments are changed to ensure that the balance is paid over the term of the loan.  There is nothing added to the amount owed.  But I’m guessing there will be additions to the number of times we see it being said.

Do we need another category in the mortgage arrears data?

Last week the Central Bank published the Q4 update of their mortgage arrears dataset.  In general the situation is one of steady improvement but are we missing out on some of the underlying trends?

Q4 2016 PDH Arrears

The problem is that an ever larger proportion of the arrears accounts are in the final category for those over 720 days in arrears.  By the end of 2016 there were almost 33,500 PDH mortgage accounts in arrears of more than 720 days.  These accounts had an outstanding balance of €7.5 billion and had accumulated €2.2 billion of arrears.  Here are the reported categories as a proportion of the overall arrears problem.

Q4 2016 PDH Arrears Proportions

At the end of 2016 accounts over 720 days in arrears were 43 per cent of accounts in arrears, 53 per cent of the total outstanding balance in arrears and 89 per cent of the built-up arrears.  Can we really tell what is happening to arrears when so much is reported in an open-ended category?

We can look at what has happened to this category since it was first reported in Q3 2012.

PDH Arrears more than 720 days

There has been some improvement in the number of accounts in this category.  The number peaked in Q2 2015 at just over 38,000 and has now fallen below 33,500.  However both the average balance owing and the average amount of arrears accumulated continue to rise.  There may be a compositional effect at play if it is accounts below the average that are resolved, through whatever means, and removed from the category.

Taking that aside we see that the average balance on these accounts climbs ever higher. For the full period above it rose from €203,400 to €225,800.   This is likely a reflection of no or limited repayments being made to reduce the balance and the accumulated interest being added which increases in the balance.

The average amount of arrears also continues to rise and by the end of 2016 stood at €66,000 for these accounts.  We know these accounts are at least two years in arrears but it is hard to know how deep they go.  If the average monthly payment on these accounts was €1,500 then we are looking at accounts being, on average, something around 44 months in arrears.

It is often argued that very little has been done FOR those who are more than two years in arrears.  But it is also true that little has been done TO them.  It has not been possible to find comparable data for other countries in order to assess the extent to which they have experienced mortgage accounts more than two years in arrears.  Other countries don’t report such figures because it is something which would not be tolerated; some resolution would be applied.  That is not the case in Ireland and cases come before the courts where no payments have been received in five years or even longer.     

When the “more than 720 days” category was introduced in Q3 2012 it contained 15 per cent of accounts in arrears, 17 of the outstanding balance in arrears and 48 per cent of the built-up arrears.  As shown above, those figures are now 43 per cent, 53 per cent and 89 per cent.  OK, part of this reflects the improvements that have seen the arrears figure fall for the past few years but it’s clear these improvements have not been reflected in the 720 day category to the same extent.  A final open-ended category that contains a lot of the observations means we are limited in what can be learned from the data about some of the underlying trends.

It tells a lot about the approach to the problem that it is now necessary to introduce a category for accounts more 1,440 days in arrears.

Saturday, March 18, 2017

Company gets battered for paying higher rate of tax

The New Zealand Herald has a breathless story under the headline “Apple pays zero tax in NZ despite sales of $4.2 billion”.  The story takes the usual approach of linking sales and corporation tax regardless of the well-established principle that corporation tax is paid on profit not sales.  But this piece goes further and ignores the principle that companies pay tax to the country where their activities take place, not where their customers are located.

The Apple subsidiary at the centre of the piece made a profit of $113 million from 2007 to 2016 and its accounts show an income tax expense of $34 million.  On this the New Zealand Herald says:

The accounts also show apparent income tax payments of $37 million - but a close reading shows this sum was paid to Inland Revenue but was actually sent abroad to the Australian Tax Office, an arrangement that has been in place since at least 2007.

A close reading of this paragraph reveals it to be nonsense.  Companies pay corporation tax to the tax authority it is due to.  The company did not pay tax to the New Zealand Inland Revenue because it did not have a taxable presence in New Zealand.  There are no Apple activities in New Zealand to tax.  The company doesn’t have a subsidiary operating there; the company doesn’t have retail stores there.  There is no permanent establishment to levy tax on.

The piece makes a big deal about the amount of iPhones sold to New Zealanders.  But the number of iPhones that Apple sold in shops to New Zealanders is zero.  The sales in New Zealand are through third-party retailers.  Apple has a company, Apple Sales New Zealand, which acts as the distributor of Apple products to these New Zealand retailers.  The company name reflects the market it services; the company itself is based in Australia.

So the company paid the tax directly to the Australian Tax Office because that is where the taxable activities of the company are located.  And this principle has been in place since the 1920s not just since 2007.

The New Zealand Herald piece has all the information that points to this conclusion but chooses to ignore it.  It is pretty easy to see that the company pays its tax in Australia and not New Zealand.  Here is the tax calc from the 2016 accounts which the piece reproduces:

Apple NZ Tax calc

The tax rate applied to the profits is 30 per cent.  New Zealand’s corporate tax rate is 28 per cent; Australia’s is 30 per cent.  The tax is determined using Australia’s 30 per cent rate because that is where it does its business.  Some minor adjustments resulted in an effective tax rate of 32 per cent in 2016 and 33 per cent in 2015.

Maybe something should have clicked when the newspaper had to look to Australia to find someone from Apple to comment on the story:

In a statement issued from Australia, the multinational technology giant stressed it followed the law but did not directly address questions about the structuring of its New Zealand operations and the apparent lack of payments to Inland Revenue.

And the piece then lays it out straight:

Apple's New Zealand operations are wholly owned by an Australian parent and appear to be run from there.

If Apple had operated this subsidiary out of New Zealand it would have paid tax at 28 per cent.  Instead, it choose to base the company in Australia where it is subject to tax at 30 per cent.  So even when paying a higher tax rate companies can take a battering.

Friday, March 17, 2017

Mortgage Repayments in BOI

The last post looked at the aggregate reduction in the stock of PDH mortgage debt in Ireland.  It was a bit crude and the aggregate nature of the data meant some simplifications were required.  Using figures from the annual reports of the banks we can get a deeper insight into the evolution of mortgage balances.  So let’s have a look at Bank of Ireland (which we have done previously here).

First, let’s look at the total amount outstanding by year of origination.

BOI Mortgages Outstanding

In the five years from the end of 2011 the stock of mortgages BOI has in Ireland declined from €27.9 billion to €24.3 billion.  Of these €19.8 billion were PDH mortgages and €4.5 billion were BTL mortgages. 

This 13 per cent reduction since 2011 masks what actually happened to the stock of loans the bank had at the end of 2011 because the bank has, of course, being issuing mortgages since then. 

If we just look at loans issued up to 2011 we again start with a total of €27.9 billion. But ignoring loans issued since then shows that these have reduced to  €18.8 billion, a fall of 32 per cent.  This falls varies by year of origination and unsurprisingly older loans show the greatest falls.

The stock of loans issued before the year 2000 fell by 63 per cent between the end of 2011 and the end of 2016.  For loans issued during the peak of the lending bubble we see that there were 29 per cent reductions in the over the same five year period for loans issued in 2006 and 2007.

The reduction in the outstanding balance could be due to:

  • repayments on the existing loan
  • re-mortgages to a new loan or new provider
  • write-downs on the existing loan

Due to re-mortgages it is probable better to look at the average balance rather than the total stock of debt.  Here are the number of accounts for each years of origination.

BOI Mortgages Number

And using these numbers we can get the average balance outstanding by year of origination.

BOI Mortgages Average Balance

This probably gives a better insight into the capital reduction on mortgages being repaid on a typical or regular basis.  For mortgages issued during the lending bubble we can see that the average balance fell by about one-sixth in the five years from the end of 2011 to the end of 2016.

So for loans originating from 2005-2008 we have a 30 per cent drop in the stock of debt in the past five years and an 18 per cent drop in the average balance for loans that remain extant at the end of 2016.  Of course, we don’t know what happened to the 12 per cent of loans originating from 2005-2008 that were discharged/ended in the past five years.  They may have been replaced by new debt or just simply repaid.  But whatever way we look at it the overall stock of debt from the credit bubble is being reduced.

Mortgage repayments accelerate capital reduction

A lot of attention is right gives to mortgage arrears and property repossessions but it most also be remember that significant mortgage repayments are also being met.  Here is the total outstanding for PDH mortgage in the mortgage arrears statistics.

PDH Mortgage Balance

Since the middle of 2009 the amount of PDH mortgages has fallen from €118.7 billion to €99.6 billion. Still a long way to go you might say but the graph a above is not comparing like with like.  Each quarter is made up of different loans with some repaid and others drawn down.  New loans will will increase the total balance so repayments on the €118.7 billion of loans that was outstanding in Q3 2009 will be greater than €19.1 billion indicated by the chart above.

Figures from the Irish Banking and Payments Federation give the following amounts of PDH mortgage draw downs since the middle of 2009;

  • First Time Buyers: €13.2 billion
  • Mover-purchaser: €11.0 billion
  • Remortgages: €1.9 billion
  • Top-up mortgages: €1.5 billion

Some of these could be existing debt replaced by new debt.  To be conservative we will assume that all loans relating mover-purchases and remortgages resulted in no new debt being created, i.e. the amount of the new loans matched the amount of previous loans. 

There will be new debt from first-time buyers and top-up mortgages. Since the middle of 2009 there have been €14.6 billion of drawn downs on these loans.

This means that the stock of PDH mortgage debt of €118.7 billion has been reduced to €84.9 billion, a reduction of 28 per cent in seven years.  And if mover-purchases and remortgages resulted in additional mortgage debt being created (as they surely did) then this is the upper limit for the reduction that has taken place.  Let’s put it at 33 per cent.

That might suggest that there is another 14 years until the stock of debt from Q3 2009 is cleared for a total duration of 21 years.  But that is to misunderstand the nature of mortgage repayments.  Early in the term the majority interest will make up a greater proportion of the repayments than later in the term.  If the level of repayments remains the same then the rate of capital reduction will increase as the amount being consumed by interest declines.

For the estimated repayments looked at here.  The average reduction in the outstanding balance for the two years at the start of the series was €1.08 billion per quarter.  For the past two years this has average €1.32 billion per quarter.  As would be expected the rate of reduction in the outstanding balance is accelerating.

We are probably looking at the stock of PDH mortgage debt from 2009 being cleared in another ten years or so.  This gives an average term of 17 years.  Of course, this is just an average.  Some loans will be repaid quicker than 17 years and other might take a good bit longer.  But what ever about the persistent problems with arrears and repossessions it is also the case that there are ongoing repayments and the stock of legacy debt is reducing.

PDH Mortgage Balance Estimated Like-for-Like

Arrears is a terrible way of measuring current mortgage distress

The release of the Q4 2016 mortgage arrears statistics generated more interest than has usually been the case for these releases for the past two years or so.  Two elements have featured heavily in the reporting:

  1. That the highest number of PDHs on record were taken into possession by lenders
  2. That there was an increase in “early stage arrears”.

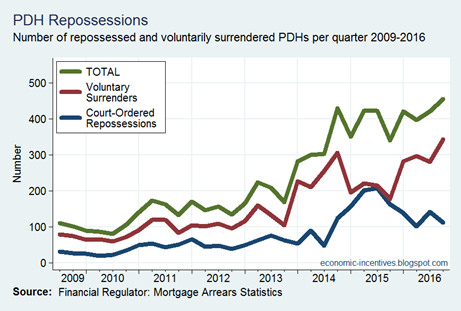
The first of these is fairly easy to identify.  At 455, the total number of PDHs taken into possession in Q4 was indeed the highest on record.

PDHs Possessed

Of these, 112 were the result of a court-ordered repossession while 343 were by agreement between the borrower and lender.  The term ‘voluntary surrender’ is a benign way of putting as the borrower will likely have faced strong pressure from the lender.  Voluntary surrenders are likely in instances where there is negative equity with hopefully agreement also reached on how to deal with any shortfall. 

There will also be instances where the borrowers undertake a forced sale of the property to clear the mortgage.  In these cases the borrowers also lose possession of the property but have some limited control over the process.  Figures for forced sales have never been collected.

The status of the properties taken into possession by the lenders is unknown but a share will be vacant or abandoned properties which should be taken into possession and resold by lenders.

There is also a divergent pattern since the middle of 2015 when there was a 50/50 split between court-ordered repossessions and voluntary surrenders.  Since then the number of court-order repossession has declined with the number of voluntary surrenders going in the opposite direction.

Since this data series began in the middle of 2009, lenders have take possession of 7,100 PDHs.  Of these 4,800 were by way of a voluntary surrenders and 2,300 the result of a court ordered repossession.  This is a small number relative to the scale of the arrears problem.

And it is suggested that part of the arrears problem could be getting worse.  Many reports are the same and this is extracted from one:

The latest arrears figures show that 23,224 mortgage accounts were in arrears for less than three months at the end of last year. This was up slightly on the previous quarter in 2016.

However, it was the first time since September [2012] there had been a rise in the numbers getting into early-stage arrears.

The editors obviously felt this was an important point and used the headline “Spike in mortgage arrears as banks repossess more homes” for the piece.  Here is the Q4 spike:

Less than 90 days in arrears

Hmmm.  There is no spike visible in the chart.  There isn’t even an increase visible.  The spike is an increase of 12.  Total.  In Q3, there were 23,212 PDH mortgage accounts in arrears of 90 days or less; in Q4 the figure was 23,224.  Yes, a rise of 12.

Experts said it was too early to say if there was a trend of arrears rising again.

They could also do with saying that the number of people in 90-days arrears doesn’t necessarily tells us anything about the number of people falling into “early-stage arrears” particular when the overall trend in arrears is down.

Arrears measures missed or partial payments relative to the contracted payment amount.  It tells us nothing about when those payments were missed.  If a borrower has a monthly payment of €1,000 and missed €2,000 worth of payments three years ago they will be 60 days in arrears – yet can have made all contracted payments in three years.

If such a borrower has €4,000 of arrears they will be 120 days in arrears.  If that borrower makes an excess payment of €2,000 they will move to being 60 days in arrears.  And this is why the number of accounts in 90-days in arrears is not necessarily a good guide to the number in “early-stage arrears”.  It can also be influenced by people moving from higher categories into lower ones.

And it can happen for odd reasons.  Consider a borrower on an agreed interest-only of €750 with €3,000 of arrears.  The borrower is 120 days in arrears.  If the interest-only period ends and the borrower moves to a capital+interest payment of €1,500 (which we assume they make) the borrower will now be 60 days in arrears.  The borrower has moved into the lower arrears category because their contracted payment has increased but the amount of arrears has remained unchanged.  Such a scenario is highly unlikely but points to some of quirks that the use of arrears as a measure of distress can result in.

Was there a rise in early-stage arrears at the end of 2016?  We can’t say but I doubt it.  It more likely reflects an improvement in the situation (i.e. lower arrears or restructures moving people into lower categories) than a deterioration.

Thursday, March 16, 2017

Ireland’s NIIP continues to improve

We have previously looked at the impact each of the sectors of the economy have on Ireland’s international investment position – that is, the balance of external financial assets and financial liabilities.  In the main the story is little changed since the previous post.

The CSO have published the Q4 2016 update of the IIP data and here is the Net IIP position for the total economy and for the economy excluding non-financial corporates.

NIIP

Excluding the IFSC the Irish economy has a NIIP of –€382 billion which is not a very good headline figure.  However, that is hugely influenced by the –€454 billion NIIP of the non-financial corporate sector.  Unsurprisingly the cross-border position of Ireland’s NFC sector is itself hugely influenced by MNCs.  And what is shown above is the net figure.

The Irish NFC sector has €785 billion of external financial assets and €1.24 trillion of external financial liabilities.  The balance gives us the net position of –€454 billion.  Are the Irish operations of MNCs bankrupt?  No. 

This chart above only shows the financial position.  There have been some step-changes in the NIIP of the NFC sector and this is related to the onshoring of intangible assets.  Some Irish-resident companies of MNCs have borrowed huge sums of money and used that money to purchase intangible assets.  The scale of this was in the hundreds of billions in Q1 2015 with ten of billions of such transactions occurring in Q4 2016.  The NIIP of these companies doesn’t really tell us anything about the underlying position of the Irish economy.

We can get a much better insight if we remove them and that is what the blue line does above.  It can be seen that this has been steadily improving since the data series began in 2012 moving from –€90 billion then to +€72 billion now.  That is a large improvement in just five years. 

NIIP by Sector

Most of the improvement has been effected through the financial system.  In the early years of the crisis many of the external creditors of the banks were repaid with liquidity from the Central Bank which itself generated a negative Target2 balance.  While the banks had a relative small net position in 2012 the net position of the Central Bank was –€91 billion at that time.  Since then the banks have reduced their reliance on central bank funding and the external position of the Central Bank has improved with that.

Of the remaining sectors, financial intermediaries have a NIIP position of +€189 billion.  This, in large part, reflects the foreign financial assets of Irish investment and pension funds.  The government sector has a negative position of –€128 billion representing the international nature of much of the borrowing it undertook in the crisis.  Add up all those and you get our net position of +€72 billion – excluding those data polluting MNCs of course!

Monday, March 13, 2017

What was and wasn’t in the preliminary national accounts?

The CSO have published the Q4 Quarterly National Accounts which give a preliminary view of the full-year outcomes for 2016.  All the caveats about these being preliminary figures were hammered home last year when the initial 7.8 per cent GDP growth rate for 2015 published in March became the infamous 26.3 per cent growth when the full national accounts were published in July.  Anyway, this time around the preliminary figures show  that real GDP grew by an estimated 5.2 per cent in 2016 with real GNP recording an increase of 9.0 per cent.

GDP GNP 2016 Growth Rates

At first glance a five per cent growth rate seems about right for the Irish economy but the nature of Ireland’s macro statistics means we cannot simply take it at face value and, given the gap to the nine per cent growth in GNP, there may be reason to believe that the underlying growth rate of the economy could a bit above the five per cent growth seen in GDP. 

One explanation for the differing GDP and GNP growth rates could be if MNC profits in Ireland contracted in 2016.  This would mean that the value-added from the “domestic” economy grew by more than five per cent, and as this accrues to Irish-residents this would translate into a higher growth rate for GNP.  If ten per cent lower MNC profits was the only thing affecting the net-factor-income-from-abroad adjustment to get GNP then we could take the nine per cent growth rate of GNP as reflecting the performance of the “domestic” economy.  But such simplicity is a realm that Irish economic statistics have long departed.

In recent years there have been a few things other than the level of MNC profits in Ireland that have affected net factor income from abroad.  For example, the additional growth in GNP seen in 2016 could be due to an increase in MNC profits in Ireland not counted as a factor outflow because, say, of increased depreciation on MNC assets in Ireland (including intangibles) or it could be because of an increase in net factor inflows to redomiciled PLCs with their nominal headquarters in Ireland. 

We cannot see the first of these effects in this week’s release as a depreciation figure will not be available until the full National Income and Expenditure accounts are published in a few months.  Outflows of direct investment income fell from €59.7 billion in 2015 to €57.5 billion.  This could be because of a fall in MNC profits earned in Ireland or an increase in the amount of MNC profits consumed by the depreciation of their Irish assets.  However, looking (as best we can) at things like contract manufacturing suggests that MNC profits did indeed fall in 2016.
Goods Trade 2015 and 2016

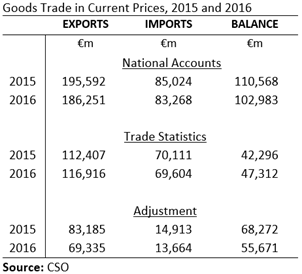
In the National Accounts, the value of Ireland’s goods exports fell by around €9 billion in 2016.  However, in the custom-based External Trade data the value of the goods which were physically exported from Ireland rose by €4.5 billion.  The difference arises from the adjustments made for things like contract manufacturing in other countries undertaken for Irish-resident companies.  Here is the difference between the goods export figures in the Quarterly National Accounts and the External Trade Statistics since 2010.

National Accounts Goods Exports Adjustment

As the previous table shows there were €83.2 billion of additional goods exports in the 2015 National Accounts.  The preliminary 2016 figures suggest that this fell to €69.3 billion.  We can see that the associated trade balance of these adjustments with this fell by €12.6 billion in 2016. 

We have to be careful about inferring the GDP effect of this.  For a start there may have been a fall in royalty imports (though assuming most of the €12.6 billion fall is related to the activity that came with the 2015 surge that will not have been the case) and, secondly, these trade figures are nominal so there may have been price and/or exchange rate movements involved which would need to be accounted for before putting them in the context of changes in real GDP. 

And with nominal GDP growing by 3.9 per cent compared to the 5.2 per cent real growth rate, it is clear there was some price deflation with a lot of this arising on the goods trade side.  Nominal goods exports fell by 4.8 per cent but real goods exports only fell by 1.2 per cent.  We sold almost the same volume of goods in 2016 as we did in 2015 but lower prices meant the value was almost five per cent down.

But back to the higher growth in GNP.  There may have been more MNC profits consumed by depreciation in 2016 but we have no evidence of that (yet).  We do have evidence, through the contract manufacturing channel, of reduced MNC profits though there could be offsetting profit increases from their actual activities in Ireland.  Still, this hint of reduced MNC profits would suggest that the underlying growth rate of the economy in 2016 was above the five per cent GDP growth rate. 

It is not all the way to the nine per cent GNP growth rate as there is very likely to have been a redomiciled PLC effect pushing up GNP.  Inflows of direct investment income rose from €15.8 billion in 2015 to €18.8 billion in 2016.  Some portion of this may be increased foreign earnings of Irish MNCs but redomiciled PLCs contribute significantly to these inflows. 

The fall in outbound profits of MNCs and the rise in inbound profits of, presumably, redomiciled PLCs explains most of the change in net factor income from abroad which, in nominal terms, rose from –€53.2 billion in 2015 to –€47.5 billion in 2016.  It is because of these direct investment flows that GNP grew faster than GDP.  Whether that means the “domestic” economy grew by more than five per depends on what caused the fall in outbound MNC profits.

These are precisely the problems that it is hoped the new national income measure, GNI*, will address.  In rough terms GNI* will be the standard “GDP less net factor income from abroad” to get to GNP with the (positive) balance of EU taxes and subsidies used to get to GNI.  After that, additional adjustments will be made for the depreciation of intangibles that MNCs have located here and the net income earned by redomiciled PLCs.  With these adjustments we should get a better measure of aggregate income developments for Irish residents.  It’s little more than a guess but, assuming some fall in MNC profits last year, a growth rate in 2016 for GNI* of somewhere around 6 to 7 per cent may not be too wide of the mark.

So lets look at some of the sources of that growth.  First, the output approach:
GDP by Sector of Origin 2016

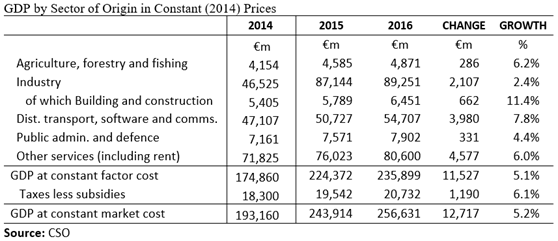
We see that all sectors of the economy grew in 2016.  The slowest real annual growth was the 2.4 per cent for the MNC-dominated industry sector and, of this lower growth in 2016, around one-third was due to building and construction even though it makes up only around seven per cent of the sector’s value added.  Value added in building and construction grew by 11.4 per cent in 2016.

MNC profits in the industry sector were the source of almost all of the excess that made up the 26 per cent growth in 2015 (as comparison to the 2014 figures show) but nothing like this happened in 2016.  This is reflected in the sectoral Corporation Tax receipts published by the Revenue Commissioners which show that CT receipts from manufacturing grew by three per cent in 2016.

As well as building and construction, the other non-MNC dominated sectors also grew fairly strongly with agriculture (6.2 per cent), public admin (4.4 per cent) and other services (6.0 per cent) all contributing strongly to growth.  Product taxes grew by 6.1 per cent and combining all of these gets us to the 5.2 per cent growth in real GDP at market prices.  With an overall MNC performance that seems weak this looks like the odd occasion when we can attribute the most of the growth to the non-MNC part of the economy.

That is not to say that there were not MNC effects in the accounts; just that they were largely GDP neutral.  The preliminary 2016 figures for the output approach might be relatively clean but the expenditure figures are a mess. 

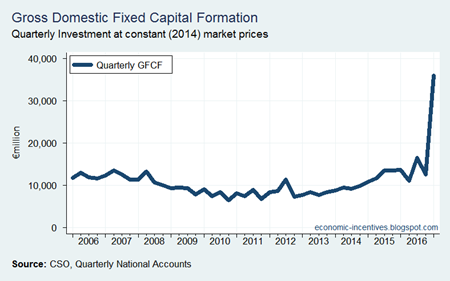
OK, public and private consumption are fine with real private consumption growing by 3.0 per cent and public consumption motoring along with a real growth rate of 5.3 per cent but after that the figures are all over the place.  One chart is enough to highlight the nature of it.  Here is real quarterly investment (2014 prices) since 2006.
Quarterly GFCF since 2006

This series had been volatile recently because of aircraft and intangibles but it went “off the chart” in Q4.  More investment took place in last quarter of 2016 than in each of the years from 2010 to 2013.  The spike is bizarre but this is what we have come to expect in Irish economic statistics.  Like other recent changes it is related to the onshoring of intangible assets but the nature of the transaction that brings the intangible here is important. 

Some of the recent onshoring has been achieved by the company holding the IP becoming Irish-resident.  This involves a balance sheet relocation and while the IP is added to Ireland’s capital stock there is no domestic transaction to be reflected in the investment series.  The profits that the IP generates will be included in Irish GDP. 

The fact that the large onshoring in Q4 appeared in the investment data indicates that this was a transaction undertaken by an entity that was Irish-resident at the time the acquisition took place.  Although the size of the transaction runs to tens of billions of euro it is actually GDP neutral as the intangible has to be imported.  We can see this in the Balance of Payments current account which shows a huge spike in all business services imports.

Business Services Imports 2016

We know that the spike relates to intangibles (the CSO press statement says so) but unfortunately the Q4 figures for R&D imports and intangible investment have been suppressed.  Here is an extract from the CSO response to the recent group set up to explore ways to improve the presentation of Ireland’s macroeconomic statistics:

Recommendation 6: Quarterly publication of underlying investment and underlying domestic demand measures that take account of the impact of IP relocations, contract manufacturing, aircraft leasing and re-domiciled firms.

Deliverable:  The CSO currently publishes a breakdown of investment by tangible and intangible assets on a quarterly basis. We will add to this detail by quantifying the flows of IP relocations and aircraft leasing activity in 2017, in current and constant prices, at the time of the annual National Income and Expenditure results in mid-2017.

Well “currently publishes” is what they used to do.  Here is the table from this week’s release (click to enlarge).
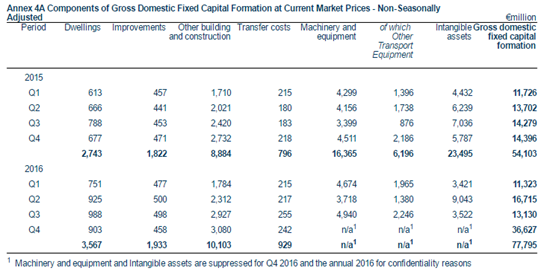
Table 4A GFCF

The breakdown of investment by tangible and intangible assets for Q4 or 2016 as a whole was not provided.  So instead of going forwards we’re going backwards. It is not clear what has been achieved by this suppression.  It seems pretty clear that intangible investment in Q4 2016 was in the range of  €28 billion +/- €1 billion. 

Investment in intangibles is made up of three components:

  • in-house R&D carried out by the public and private sectors in Ireland
  • net service imports of R&D carried out for/in other countries
  • net outright purchases of IP assets to/from other countries

The Q4 spike (on the assumption of no similar sized transaction in Q1 2017) will have been in the last of these reflecting the one-off nature of the onshoring.  But how much more would we learn about the onshoring that took place if the figure for intangible investment in Q4 was actually provided?  We know it happened and we could probably have a good stab at working out the size of the transaction as the first two items are reasonably steady. 

But not knowing the precise level of intangible investment isn’t that serious an issue.  We don’t need to know it and to get measures of underlying investment and underlying domestic demand these transactions relating to the onshoring of IP are actually something we want to strip out.  But suppressing one figure is not enough; a minimum of two figures must be suppressed to make it effective.  And this means losing one of the key components of underlying investment.

In this instance, it is machinery and transport equipment.  After netting out ‘other transport equipment’ (i.e. rail, air and sea transport equipment but almost exclusively wide-bodied aircraft related to leasing activities) we are left with underlying machinery and equipment investment and this has ranged between €1.0-€3.0 billion per quarter (in 2014 prices) for the past six years.  Underlying machinery and equipment investment increased strongly from late-2012 through to the middle of 2015 but since then has been on a firm downward trajectory.

Machiner and Equipment Investment

The fall is notable but it is just another quirk in the statistics.  It is related to investment in equipment to manufacturer semi-conductors and processors (item 728.21 in the Trade Statistics).  Irish imports of such equipment spiked from virtually nothing in 2012 to around €1 billion in 2014 and 2015 and have fallen away again.

Processor Manufacturing Equipment

This is what has caused the fall in the red line above.  We could make yet another adjustment for that but pretty soon you get to the stage where there is no point in aggregating anything and we just look at everything individually.  And these machines are being installed here so while it is a useful pattern to be a aware of it does represent activity actually happening in Ireland.

While we don’t have any Q4 2016 figures for machinery and equipment investment in the QNAs it has been possible to identify investment in ‘other transport equipment’ in other data series published by the CSO, namely the External Trade statistics.  The following chart shows quarterly net imports of category 79: other transport equipment in the Trade Statistics and investment in other transport equipment in the Quarterly National Accounts since the start of 2010.

Trade and Investment in Other Transport Equipment

It is hard to tell but there actually are two lines shown for the period from 2010 to 2014.  The near perfect relationship stumbles a bit in 2015 before sundering completely in 2016.  It seems the ability to identify investment in ‘other transport equipment’ from the Exterbal Trade statistics is no more for some reason.  Net imports of ‘other transport equipment’ were €2 billion in Q4 2016 and that seems as likely as figure as any for investment in ‘other transport equipment’ in the quarter but it is a (somewhat informed) guess. 

If we use that €2 billion figure we are left with €30 billion of investment in Q4 to allocate between underlying machinery and equipment and intangibles.   The likely figure for underlying M&E in Q4 is between €1 billion and €3 billion.  It is this that gives us the €28 billion +/- €1 billion for investment in intangibles in Q4.

The equivalent Q4 underlying machinery and equipment investment figures for the prior two years were €2.0 billion and €2.3 billion respectively and are in the middle of the €1 billion to €3 billion range but determining the annual growth in underlying machinery and equipment investment is no longer possible.  As shown above the reported figures for Q1 to Q3 2016 showed a rather alarming 18 per cent drop in underlying machinery and investment investment compared to the same period in 2015.  Given the likely range of figures for Q4 the annual change in underlying machinery and equipment investment could have been anything from –27 per cent to –7 per cent.  We simply don’t know. 

For underlying investment the likely range for growth in 2016 is from –3.7 per cent to +4.8 per cent with the poor performance of underlying machinery and equipment being offset by strong growth in dwellings (+27.6%), improvements (+6.4%), other building and construction (+11.4%) and transfer costs (+9.7%) .  The poor performance in underlying machinery and equipment may seem puzzling (-18% year-to-date to Q3) given the strong growth in the other categories, but outside of equipment relating to processor manufacturing it too is probably showing positive growth as well. 

GFCF 2015 and 2016

With the 45.5% annual increase in investment driven by the onshoring of intangibles it would be nice to know what is happening to underlying investment in the economy.  Even with the growth in the categories shown in the above table the performance of underlying investment has been flat for the past year (noting that the chart below does not have Q4 figures).  But if strip out all machinery and equipment (a crude way of overcoming the issue with processor manufacturing equipment highlighted above), the story is much more positive.   This gives the red line in the chart below and that has growth of 14.4 per cent in the year-to-date to Q3 2016 (from 7.6 per cent in the FY 2014).

Underlying Investment

But the absence of Q4 figures for underlying investment also feeds into determining the growth of underlying domestic demand, though at the scale of that (c.€150 billion) the €2 billion range we have identified is not as significant with the likely growth in underlying domestic demand last year being somewhere between 2.3 per cent and 3.8 per cent.
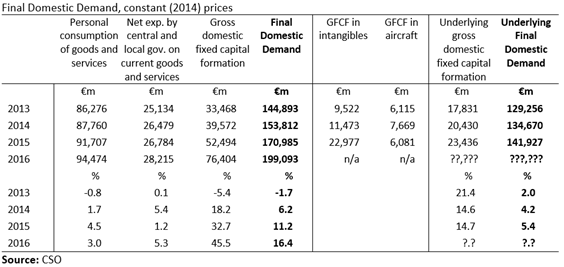
Final Domestic Demand Table

After growing by 4.2 per cent in 2014 and 5.4 per cent in 2015 it looks like the growth of underlying final domestic demand slowed in 2016, pulled down by slower consumption growth and the fall in machinery and equipment investment.  But because of the suppressed figures we don’t know to what extent.  And just when the need to adjust for intangibles has never been greater.

Final Domestic Demand

And all this uncertainty derives from an onshoring event that we probably wouldn’t learn a whole lot more about if the suppressed figure for intangible investment in Q4 was actually provided.  Maybe we were lucky to get what we got, but still… 

Printfriendly