Showing posts with label National Debt. Show all posts

Thursday, December 13, 2018

The continuing remarkable improvement in Ireland’s Net International Investment Position

The Net International Investment Position (NIIP) of a country is the balance of external financial assets and liabilities.  In headline terms, Ireland is a huge debtor nation with a negative NIIP of around €420 billion, or around €90,000 for every person in the country. 

While this can put Ireland at the top (or maybe the bottom) of international tables two factors are worth noting: the impact of the IFSC and MNCs on Ireland’s data.  Both of these contribute significantly to Ireland’s NIIP position but these debts will not fall on the shoulders of Irish people so there inclusion in the €90,000 net debtor position is misleading. 

And if we strip them out we get an entirely different picture.  Here is Ireland’s NIIP excluding the IFSC and the non-financial corporate (NFC) sectors using all available data in the latest series.

NIIP ex NFCs Q2 18

It would be nice to see this series extended backwards but it is not a surprise to see that we had a debt position of around €100 billion at the start of 2012.  Since then the turnaround has been remarkable and we have moved to a net creditor position of almost €120 billion.  On a per capita basis we have €25,000 more external financial assets than external financial liabilities.

It could be that stripping out the entire non-financial sector omits some important information.  Stripping out the NFC sector does purge the data of the polluting impact of foreign-owned MNCs but the international position of domestic firms is excluded as well.  However, there is nothing to suggest it would alter the underlying pattern shown above.

It is worth looking at a sectoral breakdown of the above aggregate position.  There are four sectors included in the total shown above:

  • General government (public debt)
  • Monetary authority (central bank)
  • Monetary financial institutions (banks)
  • Financial intermediaries (pension and other investment funds)

Here is the contribution of each to the underlying NIIP shown above

NIIP by Sector Q218

The negative NIIP €130 billion for the government sector is unsurprising and, of course, is linked to the c.€200 billion of debt that the government has, and this NIIP position has been largely unchanged for the past few years.

On the other hand, financial intermediaries has seen a sustained improvement in their positive NIIP, rising from €100 billion at the start of 2012 to €200 billion in the latest data.  This largely reflects the value of private pension and investment funds of Irish households.  This increase will be the result of additional contributions but also revaluation effects, reflecting the rising value of various financial assets through the period.

The NIIP of monetary financial institutions has changed little over the period shown.  It was close to zero in 2012 and had edged up to around +€20 billion by the middle of this year.  One reason for this is that the chart excludes the chaos of the 2008 to 2010 period when the banks ran into huge problems and their external liabilities would have been bouncing around.

We know that during this period the banks repaid almost all of their external creditors and did so by drawing down huge amounts of central bank liquidity which reached up to €180 billion at one stage.  This improved the NIIP of the financial sector but merely transferred the external liabilities to the central bank, at least until the banks were able to repay the central bank liquidity they were using.

And this is can be seen.  At the start of 2012, the monetary authority (the Central Bank of Ireland) had a negative NIIP of around €100 billion.  This largely reflected a liability to the Eurosystem in respect of the liquidity provided to Irish banks to allow them to pay their creditors.

Since then, the banks have been reducing the size of their balance sheets but in terms of the NIIP this shows up through the position of the central bank rather than the banks themselves as they have been using the reduction in loans and increase in deposits to reduce their reliance on central bank liquidity, which in turn reduces the central bank’s liabilities to the Eurosystem.  This is the deleveraging we have been going through for the past decade or so.

And the net result is that, if we strip out the IFSC and MNCs, Ireland has a positive international investment position of almost €120 billion.  It has been a remarkable turnaround.

Of course, this aggregate does not reflect the distribution.  The biggest debtor is the general government sector which, in a sense, is all of us, while the biggest creditor are financial intermediaries which reflect the pension and investment savings of a much narrower subset of households.  And it is also the case that some of the improvement in the financial position has been brought about by the sale of real assets.  Still it’s much better to be talking about the distribution of assets than the burden of debt.

Thursday, March 16, 2017

Ireland’s NIIP continues to improve

We have previously looked at the impact each of the sectors of the economy have on Ireland’s international investment position – that is, the balance of external financial assets and financial liabilities.  In the main the story is little changed since the previous post.

The CSO have published the Q4 2016 update of the IIP data and here is the Net IIP position for the total economy and for the economy excluding non-financial corporates.

NIIP

Excluding the IFSC the Irish economy has a NIIP of –€382 billion which is not a very good headline figure.  However, that is hugely influenced by the –€454 billion NIIP of the non-financial corporate sector.  Unsurprisingly the cross-border position of Ireland’s NFC sector is itself hugely influenced by MNCs.  And what is shown above is the net figure.

The Irish NFC sector has €785 billion of external financial assets and €1.24 trillion of external financial liabilities.  The balance gives us the net position of –€454 billion.  Are the Irish operations of MNCs bankrupt?  No. 

This chart above only shows the financial position.  There have been some step-changes in the NIIP of the NFC sector and this is related to the onshoring of intangible assets.  Some Irish-resident companies of MNCs have borrowed huge sums of money and used that money to purchase intangible assets.  The scale of this was in the hundreds of billions in Q1 2015 with ten of billions of such transactions occurring in Q4 2016.  The NIIP of these companies doesn’t really tell us anything about the underlying position of the Irish economy.

We can get a much better insight if we remove them and that is what the blue line does above.  It can be seen that this has been steadily improving since the data series began in 2012 moving from –€90 billion then to +€72 billion now.  That is a large improvement in just five years. 

NIIP by Sector

Most of the improvement has been effected through the financial system.  In the early years of the crisis many of the external creditors of the banks were repaid with liquidity from the Central Bank which itself generated a negative Target2 balance.  While the banks had a relative small net position in 2012 the net position of the Central Bank was –€91 billion at that time.  Since then the banks have reduced their reliance on central bank funding and the external position of the Central Bank has improved with that.

Of the remaining sectors, financial intermediaries have a NIIP position of +€189 billion.  This, in large part, reflects the foreign financial assets of Irish investment and pension funds.  The government sector has a negative position of –€128 billion representing the international nature of much of the borrowing it undertook in the crisis.  Add up all those and you get our net position of +€72 billion – excluding those data polluting MNCs of course!

Thursday, June 25, 2015

Debt in Ireland is around 260 per cent of GDP and falling

At the end of 2014 the level of ‘real economy’ debt in Ireland was reported as being:

  • Household Debt: €157.7 billion
  • Government Debt: €203.3 billion
  • Non-Financial Corporate Debt: €303.4 billion
  • TOTAL DEBT: €664.4 billion

Household debt is the total loan liabilities of the household sector, government debt is the total of general government debt under the Maastricht criteria and NFC debt is the total consolidated loan and non-equity security liabilities of the corporate sector (excluding financials). The NFC figure is for 2013 as a consolidated figure for 2014 has yet to be reported but the non-consolidated data that is available does not show much change on 2014.

It mightn’t be by much but the massive total has begun to come down.

Total Debt

Of course it is important to consider the size of the debt in relative terms so here it is a per cent of GDP.

Total Debt to GDP

If we look at the pattern by sector we do not see too many surprises. Note that the 2014 reduction in general government debt is related to the liquidation of the IBRC.

Debt by Sector

The exception to this is the pattern of the red line – NFC debt – which continued to increase after the ending of the boom and showed rapid acceleration in 2011.  The reason for this is the large presence of MNCs in Ireland.  Data from the CSO now allows us to decompose NFC debt in Ireland into two categories and “uses the residency of the ultimate controlling parent as the basis for distinguishing between Irish-controlled and Foreign-controlled enterprises.”  This gives the following pattern:

NFC Debt by Owner

The difference between the two lines reflects the impact of foreign MNCs on the NFC debt figure for Ireland and it can be seen that this gap widened considerably in the last few years.  The debt attributed to foreign-parent NFCs in the Irish data was equivalent to 107 per cent of GDP in 2013.  Again the data do not yet go to 2014 but it is likely that the debt of Irish-parent NFCs did not change much in 2014.

The CSO also note that:

In the period since 2009 several large multinational corporations have relocated their head offices to Ireland, thus becoming an Irish Parent in this analysis. However, their impact on the scale of Private sector debt during this time is relatively small due to the fact that the debt instruments (debt securities and loans) play a minor role in the structure of their balance sheets which are predominately composed of equity liabilities vis-à-vis the rest of the world.

Here are the sectoral debt levels but only including the ‘Irish-parent’ component of NFC debt.

Debt by Sector - Irish

If we get a relative measure for these using GDP we see the following (the pattern is much the same whether one uses GNP or some hybrid measure though the levels will be different):

Debt by Sector to GDP - Irish

Depending on what happened to the debts of Irish firm in 2014 (probably not a lot) the total at the end of 2014 would have been around 260 per cent of GDP.  This is a large amount of debt but is now on a sustainable path.  There are two further points that buttress this.  First, the interest rates on much of this debt are very low and, second, there are two sides to a balance sheet.

And to conclude here is the total (which assumes that the total debt of Irish-parent NFCs was unchanged in 2014):

Total Debt to GDP - Irish

Figures for Irish debt of 400 per cent of GDP (or 500 per cent of GNP) are sometimes bandied around.  Even larger figures can be mustered up using non-consolidated data. 

Here we note that a 400 per cent figure relates to 2012 and is only possible with the inclusion of the debts of foreign-owned MNCs which do not have to be paid from Irish income.  The use of a figure that is three years out of date and makes an error equivalent to our entire GDP offers little.

Wednesday, February 25, 2015

How deep is the hole?

A recent report on debt and deleveraging from McKinsey attracted some attention, due in part to the location of Ireland in a few of the key charts.  Ireland is shown to have had the largest increase in debt as a proportion of GDP since 2007 with the overall level of debt in the economy put at 390 per cent of GDP.

We have looked at the relevance of such statistics many times before – such as here, here and here.  We will do the same here but using data from the Institutional Sector Accounts and revised Balance of Payments statistics being produced by the CSO under BPM6.

The measured level of debt in Ireland rose steadily from 2003 to 2007 during the credit bubble but then somewhat counter-intuitively accelerated rapidly when the crash hit in 2008.

Total Debt

Obviously, government borrowing accounts for some of this but the scale of the increase is significantly greater than can be explained by the fiscal deficits.  As can be seen in the chart below the debts of non-financial firms also accelerated in 2008 which runs counter to the narrative of the busting of the credit bubble.

HH NFC and GOV Debt

The 2013 figures in the above charts are:

  • Household Debt: 96% of GDP, €168 billion
  • Non-Financial Corporate Debt: 174% of GDP, €303 billion
  • Government Debt: 132% of GDP, €232 billion
  • Total Debt: 402% of GDP, €703 billion

The measure of government debt includes the debts of the IBRC which was initially left in the financial sector when it was established but has since been re-categorised as part of the government sector.  This was a significant factor in 2011 and 2012 but the liquidation of the IBRC that began in February 2013 has reduced its impact on the government’s balance sheet.

Two key issues need to be addressed:

  1. Is the hole really €700 billion? If it is we’re goosed.
  2. What explains the rise of the red line (NFC debt) in the above chart?

We answered these questions before but here we will look at them using revised balance of payments and international investment data from the CSO. 

An important measure for any economy is gross external debt: the amount borrowed from foreigners.  For Ireland there is the complication of the IFSC (which has external liabilities – and assets! – of several trillion).  However, the CSO also provide this data excluding the impact of the IFSC.

External Debt

The updated data series is not lengthy but we can see what has been happening recently.  Ireland’s gross external debt is falling, albeit slowly, but is still around €465 billion.  That is a big hole.

The measure of net external debt accounts for the foreign assets in debt instruments held by residents.  That has fallen below €100 billion.  However, we cannot say that those who who have the foreign debt liabilities also hold the foreign debt assets. 

We can examine this by looking at the sectoral breakdown of the gross external debt.

External Debt by Sector

This is an instructive breakdown.  The continued increase in the external borrowings of the government sector well understood.  It can be seen that the external liabilities of the monetary authority (Central Bank of Ireland) and monetary financial institutions (the banks) have been declining rapidly as the banks deleverage and repair their balance sheets.

What is most notable is the increase in external debt associated with direct investment which has risen to €160 billion (almost 100 per cent of GDP).  This is the external debt of MNCs in Ireland.  This is the sector that has shown the greatest increase over the past few years and is what accounts for the increase in the red line in the second chart from the top.

So that answers one question. NFC debt is increasing because of the activities within the MNC sector – mainly intra-group treasury operations.

Using these we can reconsider the gross and net external debt figures but excluding the impact of FDI.  Doing so gives the following result.

External Debt by Sector ex FDI

Excluding the external liabilities of MNCs reduces Ireland’s gross external debt to around €300 billion (while excluding the external debt assets of the MNCs actually increases Ireland’s net external debt to €140 billion).  The downward slope of the blue here contrasts with the upward slope of the blue line in the first graph.  What we see here is a better indicator of where we are and where we’re going.

A gross external debt of €300 billion is around 175 per cent of GDP.  This is a significant external debt burden but is a long way from 400 per cent of GDP.  There has also been a rapid fall in this measure of external debt which has been reduced by around €100 billion in early 2012 when it was just over €400 billion.

Obviously the overall amount of debt in the economy is greater than €300 billion but the money owed to non-residents is a key indicator.  The banking sector in Ireland moved to a net international investment position of near balance after the collapse(though was largely replaced by an external debt by the Central Bank which has since reduced).  While we have unresolved domestic issues with household debt through mortgages and debts in the SME sector our external debt position has improved markedly (and probably wasn’t as bad as some headline figures may have suggested). 

A major determinant of any default event is external debt and outward interest flows. The reduction in external debt and the extremely low interest rates mean that this outflow is declining.

  • How do we make it fall further? There are four steps that can be taken.

    1. Stop borrowing more from abroad.  The government sector is the only domestic sector that continues to borrow more from abroad.  This may be drawing to a close.
    2. Repay debt from income.  Ireland is running a current account surplus which can provide the resources to repay debt.
    3. Repay debt by selling assets.  Asset sales to non-residents are likely a significant factor in the recent in the external debt fall. 
    4. Default. 

    Even if the rate of reduction moderates somewhat using steps 1, 2 and 3 our gross external debt should be down to 100 per cent of GDP by the end of the decade and may be even lower.  Yes, we’re in a hole (one that is around 175 per cent of GDP) but we’re climbing out of it.

    This improvement in our external position is also evident if we look at the net international investment position which accounts for all external assets and liabilities and not only those in debt instruments.  First, here’s the NIIP by sector (excluding the IFSC of course).

    Net International Investment Position by Sector

    The continued deterioration in the position of the government sector is evident as is the improvement in the external position of the Central Bank.  Financial intermediaries is likely dominated by the pension savings of Irish residents which are invested abroad.

    And finally here’s the overall NIIP for the Irish economy with the NIIP shown excluding NFCs also shown (as it is the MNCs that dominate the external position of the NFC sector).

    Net International Investment Position

    It can be seen that the NIIP excluding NFCs has improved by about €50 billion over the past 2.5 years. This is less than the €100 billion reduction in our gross external debt. This can arise if foreign assets are sold to repay foreign debt (meaning the NIIP is unchanged). Foreign assets by sector (bar NFCs) are shown in the chart here – yes, the banks have reduced (sold?) some foreign assets.

    Still a bit to go until we get to zero but we’re getting there.  I’d also guess the CSO still have a bit of work to go in moving to ESA2010 and BPM6 but they’re getting there too.

  • Thursday, February 12, 2015

    National Debt Interest: What do we spend €7.5 billion on?

    The December Exchequer Returns showed that €7,466 million of interest expenditure was incurred by the Exchequer in 2014.

    2014 Non-Voted Current Expenditure

    This is only what happens above the water.  Here is a breakdown of the interest costs by type of debt from a recent PQ (HT: Kevin).  The outstanding amounts for the end of the year are also shown on the right but it should be noted that the interest paid reflects the amounts owed throughout the year rather than just at the end.

    National Debt Interest

    The €7,466 million is actually €7,590 million of interest paid with €124 million of interest received set against it.

    The largest individual item is the €4.1 billion paid out on Treasury Bonds.  Some of this goes to the nationalised banks (AIB and PTSB) so does not leave the State sector (broadly defined).  Some goes to the ECB and NCBs of the euro area as they purchased Irish  government bonds as part of the Securities Market Programme (SMP).  However, unlike with Greece this interest is not recycled back to Ireland.

    It can be seen that €755 million was paid on the Floating Rate Bonds.  All of this is paid to the Central Bank of Ireland which will return most of it to the Exchequer as part of its surplus income.

    The State-Savings Schemes run by the NTMA resulted in €394 million of interest expenditure.  This is an intra-country transfer as it is likely almost all of the money in these schemes comes from Irish households.

    Just under €2.2 billion of interest was paid out on the €67.5 billion of loans taken out as part of the EU/IMF rescue programme.  Almost half of this interest was paid to the IMF.  It should be noted that the €13.5 billion outstanding amount of IMF loans at the end of the year reflects the repayment of €9 billion to the IMF in the middle of December.  Another €9 billion is due to be repaid in 2015 which will further reduce interest expenditure.

    Around €0.4 billion in interest was paid on €18.5 billion of loans from the EFSF (the euro area rescue fund) at an interest rate of just over 2 per cent.  Greece has €140 billion of loans at a similar interest rate from the EFSF but doesn’t begin paying interest until 2023.  The interest due is rolled up into the overall capital amount.

    [UPATE: A separate PQ shows the current interest rate applicable to the different loans drawn down under the EU/IMF programme. Again HT to Kevin.]

    The interest burden has increased in recent years but is not unique in a historical context.

    National Debt Interest 2

    Interest exceeded 10 per cent on GNP in 1985 and the current peak (2013) was roughly at half that level, though double-digit inflation did aid the reduction in the 1980s as lower interest rates and rapid growth did in the 1990s. 

    [It should also be noted that the above is based on two different GNP series as GNP was measured differently prior to 1995 and does not reflect current national accounts methodology (such as FISIM and the capitalisation of R&D).  Still the overall pattern will be pretty much as shown.]

    The current level of debt interest is high but it was expected to be higher.  Here is a figure from the National Recovery Plan published in November 2010.

    NRP Interest

    I’m not sure that drawing a figure for two numbers was entirely necessary  but we get the picture.  National debt interest expenditure was expected to be €8.4 billion in 2014 and that was under some rather benign assumptions in the four-year plan.  As we have seen it turned out be almost a billion less.  Of course, the interest savings weren’t banked; they were used to run larger primary deficits.

    [Yes, this is not a like-for-like comparison – the Promissory Notes and all that.  Let’s not go there.  If we got into it we’d probably find that interest was about €1.5 billion lower than projected.  The PNs didn’t generate an interest charge on the Exchequer while the FRNs that replaced them do yadda, yadda, yadda.]

    The reason for the lower interest cost is straightforward - lower interest rates rather than less debt.  Can the interest bill be reduced further? Probably.  A cessation of borrowing would help but that is another two or three years away at best (is that an election I see in the distance?).  Debt transactions by the NTMA will help such as the early repayment of more of the IMF loans (it could be viewed as 7-year debt at four per cent being replaced by 30-year debt at two per cent).

    Towards the end of the EU/IMF programme the NTMA did a lot of work to buy back debt and extend maturities away from the immediate post-programme period.  This made for a relatively smooth exit from the programme but means we are not in a position to make use of the extremely low interest rate environment that exists now.  Bonds maturing over the next few years are:

    • 2015: €2,261m
    • 2016: €8,157m
    • 2017: €6,416m
    • 2018: €9,284m
    • 2019: €14,542m
    • 2020: €20,892m

    There is “only” €10 billion between this year and next.  Redemptions do ramp up in 2018 and the NTMA will be advance planning for that but it would actually be better if interest rates started to rise as that would be indicative of some sort of economic recovery and, heaven forbid, even a bit of inflation.  This would mean they may be no significant increase in real interest rates.  There are also banking assets to be sold but most of that money comes under the remit of the NPRF (now ISIF) though whether the proceeds will actually go there remains to be seen.

    We could look to earn more interest from the cash reserves that the NTMA are holding.  This should be possible as the interest received is pitiful compared to the amounts held but it is likely there are rules on what can be done with this money – at least one presumes there are such rules!

    The forthcoming QE programme from the ECB will likely see the Central Bank of Ireland hold even more Irish government bonds but it is not clear whether that will result in much of a surplus to recycle back to the Exchequer. This is because the CB will purchase the bonds in secondary markets at the current abnormally low yields.  Still even the current 1.25 per cent on ten-year bonds will help.

    Overall it looks like debt expenditure in the Exchequer Account will be stable at around €7 billion over the next few years (with a portion of that going to state-owned or state-controlled entities).  This is a massive increase from the  €1.9 billion of debt interest expenditure incurred in 2006 but it looks like it can fall a proportion on national income over the coming years.

    Monday, January 6, 2014

    Inflow into State Savings Schemes continues

    Ireland may have run into funding difficulties elsewhere over the past few years by the State Savings Schemes run by the NTMA continue to attract a large net inflow of funds.

    State Savings Net Flows

    During the ‘boom’ years there was never more than a net inflow of a couple of hundred million into the State Savings Schemes and at the end in 2007 there was even a small net outflow.  However, since then the money has flowed in with average net inflows over the past six years of almost €2 billion.  The 2013 net inflow was €2.028 billion. 

    These receipts have seen the total amount in the schemes soar from €4 billion in 2007 to almost €16 billion (10% of GDP) at the end of 2013.

    State Savings Total

    The amounts in these schemes form part of the General Government Debt and now make up around 8 percent of the overall GGB.  We just have the total net inflow across all the schemes for in 2013 but the NTMA 2012 Annual Report gives a breakdown by scheme as it stood 12 months ago.

    NTMA State Savings Products

    At the end of 2012 the total in State Savings Schemes was €13.8 billion.  The table above includes “Deposits Accounts” which are the monies placed on deposit with the Post Office Savings Bank (POSB) which are managed by the NTMA.  We do not know what happened to these deposits in 2013 but if they stayed steady the equivalent table for End-2013 will show a total of €18.3 billion (given the €2 billion increase for the NTMA’s schemes).

    Before Christmas the NTMA announced a reduction in the interest paid on its products and the rates on new issues of the savings bonds/certs are now almost all below 2 percent.  For Prize Bonds the amount distributed is now equal to 1.6 percent of the balance.  The interest paid on Post Offices savings is not 0.5 percent.

    This funding, which wasn’t taken as given at the start of the EU/IMF programme in late 2010, is one reason the NTMA have been able to accumulate a large cash reserve at the conclusion of the EU/IMF funding.  Over the past three years a net €5.5 billion has flowed into the NTMA’s schemes (excluding POSB deposits).  The total cash reserve stood at around €20 billion at the end of the year, excluding the €3.7 billion of Housing Finance Agency notes held by the NTMA.

    NTMA Cash Resources

    A question sometimes arises as to what the NTMA is doing with this cash mountain.  Usually, it is kept in the Exchequer Account with the Central Bank but as can be seen above the balance between the money in the Exchequer Account and the row labelled Other has reversed.  Over the past 12 months the amount in the Exchequer Account has declined by €10.8 billion while the amount in Other accounts has increased by almost the same amount.

    The money has been moved out of the Exchequer Account and put on deposit with the ‘Covered’ Banks (AIB/EBS, BOI and PTSB). [They are no longer ‘covered’ by a guarantee but we’ll stick with the nomenclature.]

    Government Deposits in Covered Banks

    The spike in 2011 was because the money used to recapitalise the banks after the PCAR exercise was briefly put into the banks as deposits before the recapitalisation was completed.  In general, we can see that government deposits in the banks have been around €3 billion but that this rose rapidly in the early part of 2013 and now approaches €15 billion.  These deposits are a nice, though somewhat artificial, fillip to the deposit figures of the ‘covered’ banks.

    It is possible that one reason why there is €16 billion of money in the State Savings Schemes is a reluctance of people to put money on deposit with our delinquent banks while the banks themselves have frequently complained about the rates offered by the NTMA.  One could argue that the NTMA have given the deposits to the banks anyway!

    Debt Charts and Tax Arbitrage

    Charts like the following appear fairly regularly.

    WO-AQ844_BRUSSE_G_20140102175414

    The latest occurrence was on the website of The Wall Street Journal.  There is nothing wrong with the chart.  It is 100 percent accurate in what it represents.  The problem is in how it is subsequently used and interpreted, particularly in Irish media.  And as if to keep the record intact the chart appeared in the Sunday papers to declare us to be “the most delinquent of European debtors”.

    The constituent components of the figures for Ireland in the chart above are:

    SECTOR

    DEBT, €bn

    DEBT, %GDP

    Households

    €172bn

    105%

    Non-Financial Corporate

    €330bn

    202%

    Government

    €193bn

    118%

    TOTAL

    €695bn

    425%

    Ireland has a massive debt problem but the real impact on “us” needs to be understood.   The figures for the Household and Government sectors are not in dispute.  The scale and problems associated with each are fairly well understood even if resolving them is still some way off.

    What remains is the massive figure for business debt.  Do Irish businesses have €330 billion in debt?  Well, businesses in Ireland do, but not necessarily Irish businesses.  We have looked at this in more detail before and here is a chart worth reproducing:

    NFC Debt and GDP[3]

    At the zenith of the boom in 2007, non-financial corporate debt was around €200 billion.  The banking sector seized up around then but NFC debt surged to close to €350 billion.  As the previous post explored much of this was down to the treasury activities of MNCs with operations in Ireland.

    What were the MNCs doing?  They were trying to get money out of Ireland.  MNCs have been able to create “double non-taxation” on their profits using hybrid loan instruments. 

    In this arrangement a MNC subsidiary in Ireland will be financed by a parent elsewhere using an intra-company loan.  The Irish subsidiary will be charged “arms-length” interest for this loan.  Naturally, the interest paid will be allowed as a deduction in Ireland to taxable income as loan interest is a legitimate business expense.  The double non-taxation arises when the MNC originates the loan from a country that does not tax the interest income from the loan (in many cases the loan will be classified by the originator such that the income received is a dividend – this is the “hybrid” instrument).  The expense generates a deduction in Ireland and the income is a tax exempt dividend distribution in the destination country.

    Back in November the EU announced efforts to clampdown on such double non-taxation arrangements.  Under the proposals the income will not be tax exempt in the destination country. [These proposals will not change Irish tax law as we do not have a dividend exemption that allows these hybrid-loan mismatches.]

    Here is the outflow from Ireland of Direct Investment Income: Income from Debt in the Balance of Payments Annual Series:

    Direct Investment Income - Income on Debt

    The years don’t exactly match up but it can be seen that there has been a massive jump in the outflow of Income on Debt for Direct Investment Income.  The outgoing payments are now almost €5 billion a year.  Once again the tax arbitrage strategies of MNCs of skewing Irish macro data.

    So how much debt do “Irish” non-financial corporates have? The turmoil in the banking system means that we really don’t know.  What we do know is the lending of banks in Ireland to businesses in Ireland peaked at €175 billion in early 2008.  Of this, around €115 billion was to property, construction, development and other real-estate activities with around €60 billion to companies outside the construction sector (though a lot of this was also property related).

    Thus, €175 billion gives something approaching the extent of NFC debt of Irish companies.  There have been lots of changes since 2008.  Some banks have left the market, some banks have folded and lots of loans have been transferred to NAMA.  How much of the €115 billion property-related debt still exists six years later?  How much of it will actually be repaid? 

    The non-payment of huge amounts of NFC debt has added significantly to the government debt.  A large part of the €40 billion loss made by the NAMA banks when their loans were transferred to NAMA was covered by the government.  We can expect that the NFC sector won’t be repaying that much of that.  At best we can hope that the €30 billion or so paid by NAMA will be recouped.

    Losses by non-NAMA banks on development loans will be substantial as well, maybe up to €20 billion.  The €60 billion lent to non-property related sectors has decreased by around €20 billion in the past six years as lending by the banks has contracted.  Conservatively, we could knock €80 billion off the peak lending to NFCs to get the current figure.

    Here is a stab at end-2013 debt figures for the three sectors (estimated GDP: €165 billion)

    SECTOR

    DEBT, €bn

    DEBT, %GDP

    Households

    €170bn

    103%

    Non-Financial Corporate*

    €100bn

    61%

    Government

    €200bn

    121%

    TOTAL

    €470bn

    285%

    * Figure reflects “Irish” NFC debt of €40 billion lending to non-property-related sectors and property loans net of loss on NAMA transfers (these losses have already been counted in the gross debt of the Government sector) and similar losses outside the NAMA banks .

    It’s a massive mountain of debt but not as unique as the opening chart above would suggest.  A total debt of 285% of GDP would be mid-table in the chart.

    Monday, November 12, 2012

    Interest Expenditure in Ireland

    The non-financial institutional sector accounts include items for ‘interest paid’ and ‘interest received’.  However the number reported by the CSO is the total after adjustment for FISIM (financial intermediation services indirectly measured).  

    The purpose of this is to try and account for financial services that are not paid for directly but are paid for indirectly via the gap between deposit and lending rates of financial institutions.  Thus a part of interest expenditure is to pay for the cost of the money provided and a part of it is to pay for the cost of financial services provided.  This latter part is included in consumption for households and as part of intermediate consumption for non-financial businesses.

    The release last week by the CSO includes interest figures but these are after the adjustment for FISM has been carried out.  However, eurostat publish item D.41(g) which is “total interest before FISIM allocation” which allows us to produce the following table.

    Interest paid by sector 2011

    The total amount of interest paid was nearly €20 billion or 12.4% of GDP. 

    If we were to assume an average interest rate of 4.0% that would imply a total debt of around €500 billion.  At 4.5% the debt would be around €440 billion.  These figures give the ballpark for what the aggregate debt burden of the government, household and non-financial corporate sectors is.

    The FISIM adjustment for the household sector seems ‘large’.  For all years from 2002 to 2008 it was below €2 billion but from 2008 to 2009 it jumped from €1.6 billion to €4.3 billion.  It has remained high since then.  The FISIM for the non-financial corporate sector similarly rose in 2009 but it has fallen back since then.

    A table of total interest paid since 2002 and some further details on FISMIM are below the fold.

    Saturday, November 10, 2012

    Consolidated Loan Liabilities

    The release on Thursday of the 2011 Institutional Sector Accounts by the CSO gives an insight into the financial stocks (assets and liabilities) and non-financial flows (income, consumption and savings) of the main sectors of the economy.  One addition to this year’s release is the inclusion of ‘consolidated’ tables for the financial tables.  As the release says:

    This year both consolidated and non-consolidated tables are presented for the first time for the Financial Accounts.  The consolidated analysis allows a clearer view of transactions and balance sheet positions between institutional sectors. Transactions between entities in the same institutional sector are netted out in this consolidated presentation.

    The end of year (consolidated) stock of financial assets and liabilities is shown excluding stocks which exist between units within the same sector. This view of the accounts can be very useful when analysing financial instruments such as loan liabilities as the consolidated view removes inter-sectoral balances.

    Here are the consolidated debt liabilities of the household, government and non-financial corporate sectors at the end of 2011.

    Consolidated Liabilities

    The differences between the non-consolidated and consolidated figures for the household sector are zero, while there are about €5 billion of extra liabilities on the government’s non-consolidated accounts (likely related the Housing Finance Association).  

    The big difference is for the NFC sector where the consolidation reduces the liability figure by €45 billion.  These are liabilities owed by the resident NFC sector to other counter-parties in the resident NFC sector, i.e. domestic intra-company loans.

    A recent table from the IMF which included the following 2012 totals for the gross, non-consolidated debts of the three sectors as a percent of GDP got a lot of attention, including in The Wall Street Journal.

    • Household: 117%
    • NFC: 258%
    • Government: 118%

    It can be seen that the figures for the household and government sectors reconcile roughly with those in the above table.  The 2012 deficit and return to bond markets of the government sector explain the increase that will be seen in 2012.  The figures that can’t be similarly reconciled are those for the NFC sector.

    The 258% of GDP figure used by the IMF is a much greater than the 168% of GDP figure consolidated figure now provided by the CSO.  Some of the difference is due to the consolidation that removes domestic intra-sectoral balances.  It is also the case that the CSO have revised down the earlier figures. 

    When they first reported the 2010 non-consolidated loans figure for the NFC sector it was €337 billion.  In this year’s release that figure has been revised to €298 billion.

    It will also be the case that a significant proportion of the consolidated loan liabilities of NFCs are to the Rest of the World - predominantly the borrowings of foreign multinational
    corporations resident in Ireland.  Thus the 168% of GDP figure in this week’s release is still an exaggeration of what might be considered “Irish” corporate debt, which is some level less that 168% of GDP.

    According to data from the Central Bank lending from Irish-resident banks to Irish-resident NFCs peaked at €175 billion in the third quarter of 2008, of which €115 billion was to property-related sectors.  The lending to the property-related sectors is a mess and huge amounts of it won’t be repaid.  Transaction data shows that the €60 billion of non-property related lending to Irish NFCs has declined by the €6 billion in the interim.

    The figure for “Irish” NFC debt will be high at the moment but it is still the case that much of the NFC loans are delinquent property-related loans that will not be repaid.  A large portion of these remain to be resolved but this process will reduce the NFC debt figure.

    This process also means that the total of household, government and NFC debt results in some double-counting.  There are around €50 billion of property-related loans now controlled by NAMA in the NFC figure and the government loans figure includes the €25 billion of Promissory Notes to the IBRC to cover the losses on these loans. 

    Either the developers will repay the loans they have taken out (they won’t) or the government will repay the Promissory Notes (they will).  They won’t be paid twice.  The government debt figure also includes monies for the recapitalisation of the pillar banks.

    The most recent recapitalisation from March 2011 provided money to cover losses on household and business lending that the banks will incur before the end of 2013.  This has added to the government debt figure but when these inevitable losses are (eventually) resolved they will reduce the household and NFC debt figures.

    Both the household and Irish NFC sectors have seen reductions in the amount of debt they are carrying for the past four years.  This process will continue through repayments and the eventual writing down of unpayable debts.  The ongoing deficits mean that the debt of the government sector continues to increase.

    Ireland has a massive debt problem, and this top-level analysis does not reflect the huge difficulties faced by individual households and businesses, but the problem is not intractable.  The level of debt is probable somewhere around €500 billion.  This is three times GDP and four times GNP.

    Saturday, October 20, 2012

    The Level of National Indebtedness

    Writing in today’s Wall Street Journal, Eddie Hobbs has an article under the banner ‘Don’t Expect a Celtic Comeback’.  The overall thrust of the piece is true.  At best, we are at the end of the Celtic Collapse and the future direction of the economy is still uncertain.  Here, though the focus will be on a paragraph early in the article on the level of Irish indebtedness.

    The myth of Irish pluck continues today, even amid the financial crisis. Prime Minister Enda Kenny recently graced the cover of Time magazine. But according to data from the International Monetary Fund, Ireland has displaced Japan as the world's most indebted economy. Government, household and nonfinancial company debt add up to 524% of Irish GDP. (The Central Bank of Ireland uses a different basis for calculating the debt of nonfinancial firms; its estimate for total debt would be lower than the IMF's.) Funding this gargantuan load at an average cost of 4.5% would swallow nearly 24% of GDP—in other words, Ireland's entire industrial output.

    If the numbers used here were true then the Irish economy would be completely swamped by debt and would not even be treading water.  There is no way that an economy with a GDP of  €161.7 billion in 2012 would be able to carry a debt of €847 billion and an imputed annual interest bill of €39 billion.  As will be shown below the actual figures are around €500 billion and around €16 billion and these figures are determined from data hinted at in the article but then rather inexplicably ignored.

    Friday, February 3, 2012

    Repaying the Debt?

    A lot of attention recently has been given to the fiscal rules that formed the basis of the recent EU treaty (inter-governmental agreement?).  One that has attracted significant attention is the Debt Brake or “One-Twentieth Rule”.  The balanced budget rule allowed a structural deficit is no more than 0.5% of GDP is probably more important but some of the commentary on the Debt Brake is worth considering.

    On last night’s Primetime, Miriam O’Callaghan introduced a question to Kieran O’Donnell by saying:

    “People are talking about €6 billion needed to take out on an annual basis”

    On the previous night’s Vincent Browne, Stephen Donnelly said:

    “To pay down €100 billion in five years you’ve got to pay down €5 billion a year, that’s what the treaty says.”

    I have read the treaty and I don’t know where this is coming from.  The opening report on Primetime suggested that if our debt peaks at 118% of GDP in 2013 we would then have 20 years to reduce the debt and that we would have to “dramatically pay down this debt”.  The prospect of repaying debt is not an attractive one given the current state of the Irish economy.  However, it is not a prospect we are are not likely to face.

    Ireland is currently in an Excessive Deficit Procedure which is largely about getting the annual fiscal deficit below 3% of GDP.  For 2012, we are targeting a deficit of 8.6% of GDP, and the current plan is to get that down to 2.9% of GDP by 2015.  As long as a country is in the EDP it is that annual deficit rather than the total debt that is key metric. 

    And then once the country gets the deficit below 3% of GDP it enters a three-year transition period before the debt rule becomes effective.  This was explained in this Council Regulation:

    "For a Member State that is subject to an excessive deficit procedure on 8 November 2011 and for a period of three years from the correction of the excessive deficit, the requirement under the debt criterion shall be considered fulfilled if the Member State concerned makes sufficient progress towards compliance as assessed in the opinion adopted by the Council on its stability or convergence programme. "

    The implications for each country are more clearly detailed in this press release.  The last line confirms that Ireland will not be subject to the "numerical debt reduction benchmark", the one-twentieth rule, until 2018.  This is likely to be the earliest.  The three-year transition period does not begin until the excessive deficit has been corrected.  In this three-year period a country has to show is “sufficient progress towards compliance”, which is rather woolly.

    It is also important to note that the “one-twentieth” rule does mean the debt has to reach the 60% of GDP target in 20 years.  It specifies that about one-twentieth of the gap between the current debt level and the 60% of GDP target must be closed each year.

    Under the rule a country with a debt of 120% of GDP has 20 years to get the debt down to 70% of GDP, with the one-twentieth improvement getting so small that it can take another 20 years to bring the debt down to the 60% of GDP level.

    Debt Brake

    The required reductions in the debt ratio appear large at first but do moderate significantly as the debt converges on the 60% level.  This is not a linear projection that will require €x billion to repaid each year.

    Given our deficit problems, the focus until 2015 and beyond will be on bringing down the deficit rather than repaying debt.  There is no requirement to repay debt and bringing down the deficit will stabilise and, in time, reduce the debt ratio.

    So what happens in 2018?  Will we have to start “taking out” money from then?  Debt projections out to 2018 are unlikely to be very reliable.  In its last published review the IMF projected a General Government Debt of 111% of GDP in 2016.  With the planned reduction in the deficit that could be down to 105% of GDP in 2018.  No one can be sure.

    If the debt brake is applied for a country with a debt of 105% of GDP they would have to reduce the debt ratio to 101% of GDP the following year. [Technically they only have to budget to achieve the required debt reduction rather than actually achieve it.]

    A country with a balanced budget would achieve that with a real growth rate of 2% and an inflation rate of 2%.  There would be no necessity to make any debt repayments.

    In fact, once the debt ratio gets below 90% of GDP, a country with 2% inflation and growth rates would be able to run (small) deficits and still meet the debt reduction requirements.  The debt brake does not eliminate the potential to borrow additional money but it does substantially limit the rate at which this money can be borrowed.

    From an Irish perspective (and the perspective off all other countries) the balanced budget rule  is far more significant.  This requires a structural deficit of no more than 0.5% of GDP (1.0% of GDP for countries with a debt of below 60% of GDP).  If by 2018 Ireland has a structural deficit of less than 0.5% of GDP it is likely that we would satisfy the conditions of the “one-twentieth” debt brake rule without the need for any additional measures.

    If the budget has been brought into balance by 2018 (a big if but we have the luxury here of just having to assume it) it is likely that growth and inflation would do most of the heavy lifting for the debt ratio reduction.  With a balanced budget an inflation rate of 2% and a growth rate of 2% would be enough to bring the debt ratio down from 105% of GDP to 101% of GDP and all the way down to the 60% target.  We would not have to make any debt repayments but could choose to do so.

    As stated above it is the balanced budget rule which will potentially have a greater effect .  The conditions and effect of the debt brake are fairly objective and clear.  There is no consensus on how a structural deficit should be measured so the precise implications of the balanced budget rule cannot be objectively assessed.  The 3% limit on the overall budget deficit remains.

    Thursday, January 19, 2012

    Interest on the Promissory Notes

    A restructuring of the €31 billion of Promissory Notes given to Anglo Irish Bank and Irish Nationwide (now merged in the Irish Bank Resolution Corporation) has been getting a good deal of attention recently.  Much of the focus has been on reducing the interest rate coupon on the Notes but as we have said a number of times it is not clear that this would actually save the State money.

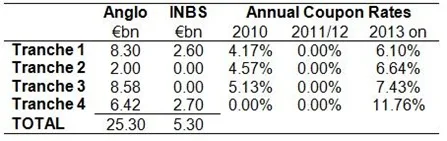
    Here is a table of the issued Promissory Notes from a previous post.

    When we account for the “interest holiday” taken in 2011 and 2012 the equivalent annual coupon for Tranche 4 is 8.6%.  This means that the average annual coupon rate across the €31 billion was about 5.8%.

    The interest rate on each tranche was based on the yield Irish government bonds of the same maturity on the day the tranche was provided to Anglo/INBS.   This increased from 4.17% to 8.60% as the tranches were issued beginning on the 31st March 2010, though the second and third tranches on the 31st of May and 28th of June 2010, and finishing with the final tranche on the 31st December 2010.

    For the first six months of 2011, Anglo reported it had Interest Income of €644 million on the €25.3 billion of Promissory Notes that it had received.  The amount of the Promissory Note outstanding was reduced to €23.8 billion when the first annual payment was made on the 31st of March.

    The “bank” also paid €519 million of interest to the Central Bank of Ireland for use of Emergency Liquidity Assistance (ELA).  The total amount of ELA the bank was drawing down stood at €45.0 billion on the 31st December 2010 and had reduced to €40.8 billion by June 30th 2011.  With an haircut of around 20% applied to the use of the Promissory Note as collateral it is clear that the Promissory Notes were supporting about half of the ELA that Anglo was drawing down.

    Therefore we could allot around €260 million of interest expense to the ELA backed by the Promissory Notes.  In the first six months of 2011 Anglo made an interest profit of around €380 million on its Promissory Notes transactions.  As Anglo is 100% state-owned this profit is not lost.  Any reduction of the interest rate on the Promissory Notes will simply reduce this profit and no money will be saved.

    What about the €519 million of interest Anglo paid to the Central Bank of which around €260 million is due to the Promisory Notes-backed ELA?  We don’t have the 2011 Annual Report for the Central Bank of Ireland yet but we we can track the flow of the interest that was paid to the Central Bank over the past few years. This is given under the heading 'Other' in the Income Received total in the Central Bank Annual Reports

    2008: n/a
    2009: €240.5 million
    2010: €510.2 million

    Given the level of ELA that was issued during these years it is possible that the interest rate charged was around 2.5%.   In 2010, Anglo paid €435 million in interest to the CBoI for ELA so it is clear that the bulk of the ELA was issued to Anglo.

    The full extent of the ELA (up to €50 billion) only arose in late 2010 so it will be interesting to track the 'Other' Income Received when the Central Bank publishes the 2011 Annual Report later in the year.

    It is hard to see if this interest is paid on to anyone else by the Central Bank, with anyone else of course being the ECB.  Earlier this week John McManus in a very good piece on the Promissory Notes in the Irish Times said:

    "The Central Bank is in turn getting the money it lends to Anglo from the ECB at a much lower and not disclosed rate which is reported to be 2 per cent or less. It keeps the difference. The real cost to the State is the rate at which the ECB provides cash and it is far from penal."

    In a piece from last February on the ELA, Laura Noonan of the Irish Independent wrote:

    “While money that comes directly from the ECB is issued for terms ranging from seven days to 90 days, the money given out through ELA is typically granted for seven days.”

    I’m not so sure the Central Bank needs to get the money.  This might be the case but it is also possible that the Central Bank of Ireland just created the money as only central banks can do.

     This little note on the ELA mentions nothing about a payment to the ECB and, says:

    The little known ELA facility allows national central banks (NCB) to provide funds to domestic financial institutions in financial difficulty over and above the liquidity provided by the ECB's regular refinancing operations. These operations are separate from the Eurosystem, but the ECB's Governing Council can with a ⅔ majority oppose the granting of further ELA, if, for instance, it considers the emergency assistance provided constitutes monetary financing.

    The assistance provided is supposed to be temporary and to an illiquid but solvent financial institution. The lending is not subject to ECB collateral requirements. Thus a bank can present its NCB collateral which would not be acceptable by the ECB (but which would be acceptable by the NCB).

    If you really want to get into ELA you can read this five-page note from Citigroup’s Willem Buiter.   On the first page it states:

    Any profits or losses made from the collateralised lending of NCBs under their ELA facilities are for the account of the NCB alone and are not shared/pooled with the rest of the Eurosystem.

    There is lots of technical sounding stuff here but it really throws little light on the subject.  To try and track these profits we can look at the Central Bank surplus that is payable to the Exchequer each year.  Here it is for the past six years.

    2005: €109.2 million
    2006: €98.5 million
    2007: €183.4 million
    2008: €290.1 million
    2009: €745.9 million
    2010: €671.0 million

    There could be other reasons for this but the Central Bank surplus has increased in the period in which the ELA has been provided.  The interest received from the ELA doubled to €500 million in 2010 but the Central Bank surplus fell.  Again it will be the 2011 Annual Report that will give a more telling indication of the impact of the ELA in the surplus that is transferred to the Exchequer.

    We know for definite that the interest profit that Anglo makes on the Promissory Notes is not initially lost as Anglo is 100% state-owned.  It remains to be seen what Anglo will do with these profits.  It appears that the chunk of the interest that the Central Bank takes for providing the ELA also stays within the State.

    Monday, January 9, 2012

    3.55% Interest on the EU/IMF loans

    Here is an update of a table showing the interest rates on the loans we are getting as part of the EU/IMF programme (HT: Kevin).  The data is for loans drawn down as of the 14th of November 2011.  Click image to enlarge.

    EU IMF Interest Rates Nov 2011

    When we last looked at this back in August for loans drawn down by June the average interest rate was 5.58%.  We can now see that this has been reduced to 3.55%.  This is because of the reduction in the EU loans agreed at the EU summit on July 21st last.

    The interest rate on loans from the European Financial Stability Mechanism (EFSM) has fallen from 6.99% to 2.97%, while the interest rate on loans from the European Financial Stability Fund (EFSF) has fallen from 5.90% to 3.06%.

    The highest rate is the 4.83% that applied to the UK bilateral loan but that is due to be reduced.  As a result of this the IMF loans will have the highest rates but they could also be reduced as there are some suggested changes to Ireland’s quota with the IMF.

    A previous post suggested we need to source around €25 billion of funding to get through 2014, as the €67.5 billion of funds under the current EU/IMF programme will be exhausted by the end of 2013.  From the above we can see that we need to be in a position to begin repaying the EU/IMF loans (by borrowing from someone else) from July 2015. 

    Replacing funding that comes at a cost of 3.55% will not be easy but for the moment it does keep a cap on our interest payments.

    Saturday, January 7, 2012

    State Funding through 2013

    Over the next two years the Irish government needs about €46 billion of funding.

    Funding Requirements 2012-13

    We still have to draw down around €33.5 billion of the loans agreed as part of the EU/IMF programme.    The remaining €12.5 billion can come from a combination of our existing resources, State Savings Schemes and some market funds. 

    There was €13 billion in the Exchequer Account at the end of 2011.  The NTMA have suggested that this could be reduced to around €5 billion over the next two years although the European Commission have indicated that they would prefer to see the cash buffer maintained at its current level.

    It is forecast that €1.5 billion a year will be raised from the State Savings Schemes over the next two years.  This is well above the 2000-2007 average but in line with performance over the last few years.  At €1.36 billion the amount raised in 2011 was just below this. 

    If the €1.5 billion a year is achieved then the State needs around €10 billion to see it through to the end of 2013.  We have €13 billion of cash on deposit (and there is also around €5 billion remaining in the National Pension Reserve Fund (NPRF)). 

    How much of this cash is used will depend on how much market funding can be raised.  The plan for the NTMA to “dip its toe” back in the markets before the end of this year, but given the amount of cash on reserve this can be delayed until 2013.

    All told the State is in a reasonably secure position for the next 24 months (where ‘reasonably secure’ simply means we won’t run out of money).  After that there is the small matter of a €12 billion bond maturing in on the 15th January 2014.

    We are due to begin repaying some of the EU and IMF loans in 2015 and there is also the need t0 find funding for the €10 billion Exchequer deficit due to arise in 2014 and the €7 billion deficit in 2015.

    While the plan is to “dip” back into bond markets before the end of 2012 we have to ensure that we have the capacity to meet the €12 billion debt rollover in January 2014 and that year’s €10 billion Exchequer deficit.  Even if the balance on the Exchequer Account is allowed to fall from €13 billion to €5 billion we will still need to raise around €25 billion of market funding by the end of 2014.

    This will be a challenge but we will not face a crunch until the start of 2014 and there is a lot that can happen over the next two years.

    National Savings Schemes

    Although have we been “shut out” of bond markets, the EU/IMF is not the only remaining source of funding for the State.  The National Treasury Management Agency (NTMA) run a series of State Savings Schemes and they have seen a substantial inflow of funds in the last few years.

    National Savings Schemes Annual Change

    After seeing annual increases of no more than a couple of hundred million between 2001 and 2006 and even a reduction in 2007 the annual change in the amount held in various State Savings Schemes soared from 2008 on.  In 2010 almost €3 billion was put into this schemes and this dropped to under €1.5 billion in 2011.

    The total amount in the schemes is almost €12 billion.

    National Savings Schemes Total

    We don’t have details for 2011 yet, but the NTMA’s 2010 Annual Report gives some insight into the breakdown of the total amounts and annual changes for the different schemes in 2010 when inflows peaked at about €3 billion.

    State Savings Schemes 2010

    There was also close to €2.5 billion is various Post Office Savings Bank Deposit Accounts (including savings stamps) which took in almost €500 million in 2010. 

    Although small in the greater scheme of things this source of funding makes a useful contribution.  An added advantage is that is cheap, the average interest rate is likely to be less than 3%.  The average rate of the EU/IMF funds we had drawn down by the middle of November 2011 was 3.55%.  At the end of 2011 the €12 billion in the State Savings Schemes will make up around 7.5% of Ireland’s General Government Debt. 

    Printfriendly