Showing posts with label Bank Assets. Show all posts

Friday, June 26, 2015

The State of the PCAR Banks

The three banks in which the State continues to hold a stake are AIB, BOI and PTSB (collectively the PCAR banks).  Here is a summary of their aggregate balance sheet position for the past five years.

PCAR Balance Sheet

The main changes are pretty clear.  Their aggregate balance sheets have declined by just over €100 billion since the end of 2010.  On the asset side this has mainly been achieved by a reduction is loans due (repayments, write-offs, NAMA transfers and other sales).  The big move on the liability side has been a reduction of €80 billion in the amount owed to the Eurosystem.  Customer deposits are up around €15 billion while debt liabilities are down around €30 billion.

Net equity in the banks is currently around €23 billion with a combined CT1 ratio of 14.5%.  The loan-to-deposit ratio has fallen from 192 per cent to 123 per cent.

Here is their aggregate income statement for the past five years.

PCAR Income Statement

As has been widely reported the banks “returned to profitability” in 2014 (well AIB and BOI did at any rate).  The €1.6 billion positive net income was mainly driven by provisioning behaviour which declined from €4.5 billion in 2013 to just €0.3 billion in 2014 with the banks writing back provisions in relation to some elements of their loan books.

Selling banks with €22.6 billion of net equity and €1.6 billion of net income in their most recent year should generate substantial funds but the amounts will be unclear as long as the problem of dealing with non-performing loans (€45.7 billion or 23.3 per cent of gross loans) remains.

Thursday, March 12, 2015

Government Bonds held by the State-Owned Banks

A lot of attention has been given to the Irish government bonds held by the Central Bank of Ireland and the benefits that arise from the recycling of interest payments back to the Exchequer.  In a vein similar to this are the substantial holdings of Irish government bonds by the ‘covered’ or Irish-headquartered banks.  A breakdown of the overall interest bill is here.

Originally the covered banks were AIB, Anglo, BOI, EBS, INBS and PTSB but now only AIB, BOI and PTSB remain.  This chart shows their combined holdings of Irish government bonds since 2008.

Cov Bonds

It can be seen that around nil in the run-up to the crash in 2008 but increased substantially during the crisis and now the banks have a holding with a market value of around €19.4 billion. 

This is significant because both AIB and PTSB are almost fully state-owned so the interest paid on these bonds does not leave the broader government sector.  There are similar benefits with BOI but to a lesser extent as that is now 14 per cent state-owned.

The recent interim financial reports for 2014 from the banks allow us to see the breakdown of this €19.4 billion across the three banks.  Some extracts from the reports are reproduced below the fold but the relevant figures for end-2014 are:

  • AIB: €9,107 million
  • PTSB: €3,857 million
  • BOI: €6,409 million
  • Total: €19,373 million

These are market value figures.  The face value is probably around 15%-20% less given than the current yields are much less than the interest coupons.  Still it is likely that between them AIB and PTSB hold around €10 billion of government bonds.  If the average interest coupon is 4 per cent then €400 million of the annual interest bill is going to state-owned banks.  It doesn’t have the full circular nature back to the Exchequer as with the interest flows to the Central Bank but it not a net loss to the State either.

It could also be considered that the money the government used to bailout the banks was borrowed from the banks themselves.  And hopefully we will be able to pay this money back by selling the equity stakes we have built up in the banks so the interest expenditure never leaves the government sector.

It is also worth noting that the banks will have made significant profits on these bonds.  Their holdings grew rapidly from mid-2011 and roughly doubled (from €9 billion to €18 billion) over the next 12 months.  Two things are notable about this period when the banks purchased these bonds on the secondary market.

  1. The summer of 2011 was when AIB and PTSB received most of their recapitalisation funds from the state (following the March 2011 PCAR exercise).
  2. It was the period when the yields on Irish government bonds were at their highest.

The banks used the recapitalisation funds, in part, to buy Irish government bonds and have made large profits on them.  The table from AIB’s annual report shows an “unrealised gross gain” of €1.3 billion from it’s holding of Irish government bonds. 

We can imagine this being roughly double, around €2.5 billion, across the holdings of the three banks. Not only are we not paying interest to third-party investors on the money used to bail out the banks, the banks actually made a profit by using the money to buy Irish government bonds on the cheap from such investors.

Here are the extracted tables. First AIB (pdf page 265):

AIB Bonds

And PTSB (pdf page 22):

PTSB Bonds

And finally BOI (pdf page 154):

BOI Bonds

Monday, October 28, 2013

Loans to Customers in the Covered Banks

A recent post looked at the state of the banks and in aggregate showed that the “Irish-headquartered banks” (AIB, BOI and PTSB) had €214 billion of loans to customers against which they had made €28 billion of provisions giving the €186 billion balance-sheet value for their loan books. 

The following table provides some insight by bank, sector and country on the aggregate figures looked at earlier.

Loans to Customers

It can be seen that about a quarter of the loans the banks have are in the UK, and these loans are performing much better than those in Ireland.  The NPL rate in the UK is around 7% (€4 billion out of €55 billion) while the NPL rate in Ireland is around 33% (€54 billion out of €159 billion).  It should be noted that the banks use slightly different definitions of non-performing or impaired loans.

How large will the ultimate losses on these loans be?  Impossible to say.  What we can say is that the covered banks have a lending exposure in Ireland of around €160 billion.  Of this nearly €60 billion is already impaired and the banks have made provisions for an average loss rate of around 50% on those loans.  That seems conservative but there may be losses above that (and also the amount of NPLs continues to rise).

For example, AIB is still carrying a €18 billion exposure to land, property and construction related lending in Ireland. Only €3.2 billion of that is rated as “satisfactory” with €13.1 billion impaired.  AIB also has €11 billion of non-property SME lending but this is similarly tied to property through hotels, pubs and other trading premises. 

Of the €16.5 billion of provisions AIB has against its loans, €7.8 billion are for loans to the property and construction sector while €3.3 billion are for non-property SME lending.  One concern may be that these are not large enough and another is that AIB may not have made sufficient provisions against other parts of its loan book, particularly Irish mortgages.

PTSB have also made provision of about 50% against their NPLs but the main problem there is the €14.3 billion of Irish and €6.5 billion of UK “tracker” rate mortgages it has.  This are a huge drag on any return to sustainable operating profitability though.

In general though, there does not seem to too many skeletons left to unearth in the loan books of the covered banks.  The ECB stress test will see some digging around but it is hard to see anything new been unearthed. Dealing with the nearly €60 billion of non-performing loans we can see are problems enough.

Thursday, December 29, 2011

Mortgages in Irish Banks (and their interest rates)

A previous post looked at loans in Irish banks.  Here will we confine ourselves to mortgages and will start from this graph in the earlier post.

Household Loans for House Purchase

The Central Bank report Private Household Credit and Deposits Statistics which allow us to look at this in a little more detail.  Here is the same graph (going back to 2003) from the Household Credit series.  The data is quarterly and runs to Q3 2011 so does not include the shifts that occurred in October 2011 that guided the previous post.

Total Loans for House Purchase

In general, the series from the two graphs are similar though the securitised series in the latter graph shows a ‘jump’ in the second quarter of 2009 that is not evident in the first graph.  As there is no corresponding decrease in “on balance sheet” loans it is not clear what was securitised (if anything).

It can be seen that banks in Ireland began securitising mortgages in the middle of 2006 and stopped by the end of 2009 (apart from €17 billion that was “derecognised” in October 2011 of course!)

The benefit of the household statistics is that we can look a little deeper into this although most of the data series only start from the fourth quarter of 2010.  We can, however, get the breakdown of the “on balance sheet” loans for house purchase back to 2003.

On Balance Sheet Loans for House Purchase

Most of the significant step decreases can be explained by increases in securitised loans although the drop that can be seen at the end of 2010 is as a result of Bank of Scotland (Ireland) leaving the Irish market.

The more detailed series are only available for four quarters.  There has been little movement in the series over this period so there is little value in graphing the series.  Here is the most recent data for September 2011 in tabular form. 

First, the total amount of loans for house purchases.

Loans for House Purchase

The €102 billion total of residential mortgages in September 2011 is significantly lower than the €114 billion reported in the Financial Regulator’s Residential Mortgage Arrears Statistics for the same time.  The primary reason for the difference is the absence of Bank Scotland (Ireland)’s mortgage loan book from the above figures.  

We are also provided with a breakdown of the €132 billion of mortgages by interest rate type: standard variable, tracker and fixed for different periods.

Mortgages by Interest Rate

More than half of mortgages in Ireland are tracker-rate loans linked directly to the ECB base rate.  With the ECB rate now back to 1% the repayments on these loans are now much lower than when these loans were taken out in the 2006 to 2008 period.  Finally, we can get a breakdown by interest type for residential, buy-to-let and holiday home mortgages.

Here is a breakdown of the €102 billion of residential mortgages by interest rate type.
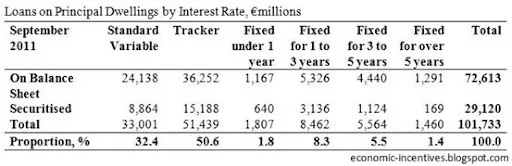
Principal Dwelling Loans by Interest Rate

Just over half of residential mortgages on are on tracker rates.  If the €10 billion or so of mortgages in the former Bank of Scotland (Ireland) were included this proportion would be even higher as most of its mortgage book comprised tracker-rate loans. 

The proportion of buy-to-let mortgages that are on tracker rates is even higher.

Buy to Lets by Interest RateAlthough they make up a very minor part of the overall market here is the same data for holiday home and second home mortgages.

Holiday and Second Homes by Interest Rate

Loans in Irish Banks

Here we will give a look at the asset side of the balance sheets of Irish banks, looking specifically at loans and in particular at some large changes that seemed to have occurred in October based on the most recent release of the Central Bank’s Money, Credit and Banking Statistics.

First up, is the total amount of loans on the balance sheets of the domestic banks, broken into the covered group (AIB, BOI, IBRC and PTSB) and the non-covered group (Ulster Bank, National Irish Bank, etc. and also credit unions).

Total Loans in Domestic Banks

There has been a fall in the amount of loans on the balance sheets of the covered banks.  Some of this is due to repayments on existing loans exceeding the amount of new loans issued but most of the drop from a peak of €513 billion in July 2009 can be explained by the transfer of over €70 billion of developer loans to the National Asset Management Agency (NAMA) and the sale of loans to other banks.

The total amount of loans the covered banks had was steady at around €400 billion from May of this year but there was another sharp drop to €377 billion in October.  It would be possible to explain this drop in a chart or two but we will use the drop as a reason to have a fuller look at the loans on the balance sheets of the banks.

Wednesday, May 4, 2011

Irish Government Bonds

We have looked at the ownership of bank bonds a number of times using the data compiled by the Central Bank.  Over on irisheconomy.ie, Prof. Karl Whelan gives a useful summary of some of the problems that arise when interpreting this data (Who Owns Senior Irish Bank Bonds?).  We examined some of this issues here.

A similar, and now very much related question, is who owns Irish government bonds?  As with the bank bonds this is generally a difficult question to answer.  According to the NTMA there are €89.5 billion of Irish government bonds outstanding.

We can get a partial insight into these from the Central Bank’s Money, Credit and Banking Statistics.   Although much of the focus has been on the liability side of the balance sheets of the covered banks, here we look at the assets.  We have previously looked at this graph here and here.

Irish Securities held by Covered Banks

The green line representing “private sector” bonds is actually mainly those issued to the banks by the National Asset Management Agency (NAMA) in return for the €71 billion of developer loans.  The promissory notes are not in this graph.  They are considered a loan to government.  Details of them can also be found in the “Loans to Irish Residents” graph here.

The blue line for monetary financial institutions is largely the covered banks themselves.  As the posts above point out they didn’t get a huge appetite for bonds in each with the vertical rise in January of this year.  This increase was due to banks holding bonds in themselves.  These “self-held” bonds were issued for three months but it looks like they are being renewed rather than retired.  The remaining €15 billion of bonds from Irish monetary financial institutions remains noteworthy.

Of central interest here is the line showing the holdings of the covered banks of bonds issued by the Irish government.  This is now just over €10 billion.  The covered banks hold about one-eight of Irish government bonds.

Should they hold more?  It might seem unusual to suggest this at a time when a sovereign default is considered “inevitable” by some.  As we saw recently Irish bond yields soared a few weeks ago and the 10-year yield has remained around 10.5%.  A higher yield means a lower price.

Debt total and ratios are usually calculated on the face or nominal value of the debt instrument in issue.  This can be different from the market value.  Although Ireland has nearly €90 billion of bonds outstanding the market value of these is lower.  If the entire market was liquidated it might be possible to buy all this for €80 billion, or maybe €75 billion, or maybe lower.  Is there any convenient way of knowing what the aggregate market value of Irish bonds are?

Anyway, should we not encourage the banks to buy more of these bonds and prices below the nominal value.  In fact, should the country not be doing it?  The NPRF still has around €10 billion in assets that haven’t been used to recapitalise the banks.  The NTMA also has €22 billion of cash in various accounts. 

Why not use some of this money to buy Irish government debt now at reduced prices instead of waiting until maturity and having to repay the full amount?  It would offer a better return than pouring it into the banks!

Tuesday, March 22, 2011

One domestic consequence of default

With talk of “unsustainable debt” and “inevitability of default” growing ever louder I think the following graph from a previous post is important.  While much of the noise has focussed on the liability side of our ailing banks this looks at some of the assets they hold, and in particular assets issued by Irish residents. 

Irish Securities held by Covered Banks

Irish exposure to Irish debt is getting ever larger.  The full implications of a banking- and/or sovereign-debt default need to be examined and this is something that those who are shouting loudest tend to ignore.  Here is the blurb that went with the graph.  This is a point that should not be lost.

The covered banks are holding more and more debt securities issued by Irish residents.  These have increased from €11 billion in January 2008 to €84 billion in January 2011.

Everything is going up.  The increase in “private sector” bonds here are mainly those issued by NAMA in return for the transfer of developer loans from the banks.  Bonds by “monetary financial institutions” are bonds issued by the covered banks themselves.  The almost vertical rise seen in January 2011 is because the banks issued €17 billion of bonds to themselves to use as collateral with the ECB.  As we saw previously, the remainder of this category is €15 billion of bonds the covered banks hold in each other.  Burning these bondholders will just mean more promissory notes will have to be issued.

I cannot really explain the rise in the holdings of “general government” bonds by the covered banks.  It seems unusual that at a time when the State was pumping billion to prop up the banks, these very same banks were using €11 billion to buy bonds issued by the State.  It appears they now hold about one-eighth of Irish government bonds in issue.  Guess who will be hit if there is a sovereign default??

Some insight into the banks’ buying of Irish government bonds is given in this May 2009 article from the Sunday Business Post.

Printfriendly