Tuesday, March 27, 2018

What is going on with GNP?

The issues with Ireland’s national accounts have gotten a good airing over the past two years or so.  Since the publication of the 26 per cent growth rate in July 2016 one that has been surprising is where some of the well-known (and not so well-known) distortions show up. 

A lot of attention has focused on GDP but apart from an extraordinary quarterly growth rate in Q1 2015 the following chart isn’t that noteworthy.  There has been a bit of volatility since late 2016 but it doesn’t seem that much different to what is showing for 1998/99.

QNA GDP Quarterly Growth Rate 1997-2017

The Q1 2015 spike clearly points to concerns about the level but that one quarterly growth rate apart most of the other outturns are within the realm of plausibility.  But what about the quarterly growth rates of GNP? GNP is what is supposed to be left after the profits of MNCs have been counted as an outflow.

QNA GNP Quarterly Growth Rate 1997-2017

This obviously shows a good deal of volatility but up the middle of 2016 it is not that outlandish.  Since then though the quarterly growth rates of GNP have been all over the place.  The last five observations are:

  • Q4 2016: +10.3%
  • Q1 2017: –6.4%
  • Q2 2017: –3.7%
  • Q3 2017: +12.3%
  • Q4 2017: +6.3%

As we commented here we have had the highest and lowest quarterly GNP growth rates in quick succession.

We might expect the relative volatility in growth rates to be the other way around: that if MNCs are causing GDP to jump around these would wash out through net factor payments and that GNP would be the relatively stable one.  The fact that MNC profits generated in Ireland are counted as a factor outflow in the period in which they are earned.  So an MNC-driven spike in GDP should be matched by an offsetting increase in factor outflows.

This is what we get if we look at the quarterly change in nominal GDP from the national accounts and the quarterly change in direct investment income on equity from the balance of payments.

Changes in GDP versus Profit Outflows

The surprising thing is how string the relationship is in 2015 and how weak it is recently.  The spike in GDP in Q1 2015 was accompanied by a spike in profit outflows. This is a bit surprising given the expected relationship between the 2015 GDP increase and depreciation.  The changes in GDP are “gross”,  i.e. before depreciation, whereas the profit outflows are “net”, i.e. after depreciation (and tax of course!).  Anyway, as GDP oscillated through 2015 the change in profit outflows tracked the changed in nominal GDP.  This continued through to the middle of 2016.

Since the middle of 2016 the changes to profit outflows have been relatively modest. The quarterly outflow was €13.1 billion in Q3 2016 and had reason fairly steadily and was put at €16.2 billion in Q4 2017. 

Over the same period GDP has been much more volatile, either rising by more (as was the case for most quarters) or falling by more (as was the case for Q1 2017).  It is the gaps between the lines in the chart above (and the changes in their signs) that have contributed to the recent volatility of GNP.

Value added has bounced around a bit over the past year and a half.  The relative stability of profit outflows means these changes in value added are being reflected in Ireland’s national income (or least are not been attributed to non-residents).

But why is this? What factors are there that can cause value added to bounce around yet not have this reflected in net profit outflows?  It could be that depreciation (of aircraft or intangibles) is playing a role but depreciation itself should be relatively stable (unless assets enter or leave the capital stock). 

If we had quarterly GNI* data we might be able to throw some light on this as,among other things, that measure is adjusted for the depreciation of aircraft and intangibles.  But until we get that we are left with the question, “what is going on with GNP?”, and even then we mightn’t be able to answer it.

Finally, just to show that outflows of direct investment income on equity in the balance of payments are the key constituent of net factor outflows in the national accounts this shows the two of them since the start of 2012:

Net Factor Income Outflows

Thursday, March 22, 2018

The Consumption Conundrum

Ireland’s national accounts get a bad rap but amidst all the distortions one would think that personal consumption expenditure on goods and services (the “C” of C + I + G + (X – M)) would be a distortion-free zone.  Of course, in relative terms, the consumption component of aggregate demand is as oasis of calm but there are a few wrinkles worth exploring.

By almost all metrics the Irish economy is motoring along nicely.  Employment is growing rapidly (+3.1% in Q4 2017), full-time employment is growing even faster (+5.4%) average weekly employees earnings are rising (+2.5% in Q4), agricultural incomes boomed (+35.2% in 2017) and though we have seen some modest income tax changes the PAYE and total USC component of Income Tax was up 8.6% in 2017.  And the population is growing (+1.1% in the year to April 2017).

But is this being translated into consumption growth?  Here are the year-on-year growth rates of personal consumption expenditure from the Quarterly National Accounts with the Q4 2017 update provided last week.

QNA Consumption Year on Year Real Growth 2011-2017

The improvement from 2011 to the middle of 2016 is probably close to what one would expect.  Growth rates returned to positive territory and then continued to edge upwards.  But the growth rate slumps from the middle of 2016 and has hovered around two per cent for the past 18 months or so.  Such sluggish growth does seem to fit with the strength seen across other indicators (a point made recently here).

We do have indicators that point to more rapid growth in consumption. At the end of 2017 the Retail Sales Index was showing volume growth of more than six per cent (excluding the volatile motor trades).

Retail Sales Index Dec 17 Growth

The index does show a slowdown in growth (but from mid-2015) rather then (mid-2016) but only briefly fell to three per cent and has been moving upwards for the past 18 months or so.

So why isn’t this being reflected in the growth of consumption in the national accounts?  One reason why the rates are different is because the measures are different.  Retail sales are only one element of consumption and exclude almost all services consumption.

The largest item in consumption is housing services.  Housing accommodation makes up one-fifth of the national accounts measure of consumption for Ireland (in nominal terms it was €17 billion out of €87 billion in 2017). 

For tenants, the amount of money paid on rent represents their spending on housing (or at least on the accommodation part).  But about 70 per cent of Irish households don’t make a regular payment for their housing – they are owner-occupiers.  They may make mortgage payments but that is a combination of a loan repayment (saving) and an interest payment for a different service – credit. For these households an “imputed” rent is calculated as if the owner was renting from themselves. 

This “imputed rent” is also counted as household income but as it is matched by imputed expenditure the net effect is zero.   Of the €17 billion of rent in consumption in 2017, €4 billion was actual rent paid by tenants and €13 billion was the imputed rent of owner-occupiers.

Regardless of the ins and outs and it should be little surprise to see that our consumption of housing has been pretty static recently. 

Housing Consumption 2004-2016

It is hard for the consumption of housing to increase when the stock of housing available for consumption is barely increasing.  So, even if other the other components of consumption are growing strongly (as the retail sales index suggests) the overall growth rate of consumption will be dragged down because the largest component (housing) is not growing at all.

But that doesn’t explain the fall off in growth seen in 2016.  We don’t get a quarterly breakdown of the components of consumption so we can only look at annual data.  In annual terms the real growth of real consumption has gone from 4.4 per cent in 2015 to 3.3 per cent in 2016 to 1.9 per cent in 2017.  Housing may be dragging the overall rates down but it is not causing them to fall.

One culprit might be insurance.

Insurance Consumption 2004-2016

Whoa!  This shows a 80 per cent fall from 2005 to 2012 and then a 200 per cent rebound up to 2014 and declines since.  Insurance isn’t a huge component of consumption (the nominal amounts are fairly close to the constant (2010) price amounts shown in the chart) but it has been volatile in recent years.

The volatility may be down to how insurance is included in consumption.  There are a number of moving parts but in rough terms it is net cost to households, i.e. Premium + Supplements – Claims.  Part of the reason for the rapid increase since 2012 shown above was a fall in claims.  They were €9.7 billion in 20112 and had fallen to €8.7 billion by 2015.

So the consumption of insurance rose rapidly from 2012 but not necessarily because households were spending more on insurance premiums but because they were getting less back in claims.  And this may have reversed in recent years so higher claims reducing the consumption of insurance. 

As stated insurance is a relatively small component of consumption but it may be partially to blame when it comes to the growth of consumption not matching our expectations based on other indicators.  And the detailed data only yet go up to the 2016.  We will learn more when we see the 2017 figures later in the year. 

The growth rates of consumption for items such as food, clothing and furniture did slow markedly in 2016 compared to what they were in 2015 but we’ll wait until the updated (and possibly revised) figures up to 2017 are published before establishing whether this is a pattern.  There is something funny going on with the volume figures for hospital services in personal consumption expenditure but it probably doesn’t add much to our narrative here though it may be a reason for some revisions.

The growth of consumption is lower than we might expect but, in looking at housing and insurance at least, this seems likely to be due to how consumption is measured for national accounts purposes rather than anything untoward in household spending patterns.  The retail sales index is probably better aligned with the money coming out of people’s pockets and the growth of that continues to tick up. 

Tuesday, February 20, 2018

PDH mortgages held by unregulated loan owners

Unregulated loan owners have been buying distressed mortgage loans over the past number of years.  Some figures on the numbers and arrears position of mortgage accounts held by non-bank entities (regulated non-bank retail credit firms and unregulated loan owners) have been included in the Central Bank’s mortgage arrears statistics since the end of 2013 and the level of detail provided has improved periodically since then. 

The regulated non-bank retail credit firms includes entities such as Dilosk, Haven, Pepper, Springboard, Start and Stepstone.  The unregulated loan owners are the “vultures”.

Initially, aggregate figures for all non-bank lenders that combined primary dwelling house (PDH) and buy-to-let (BTL) mortgages were provided.  At the start of 2016, separate figures for PDH and BTL accounts were provided and from the second quarter of 2016 these were further broken down by non-bank retail credit firms and unregulated loan owners. 

The table shows the progression of the breakdowns provided and the detail focuses on those PDH mortgages held by unregulated loan owners.

Mortgage Accounts with Non Bank Lenders

We can see that the total number of mortgages (PDH + BTL) held by non-bank entities rose sharply during early 2014. The number reached 47,000 by the end of the year and has stayed pretty close to that level ever since.

The number of PDH accounts held by non-bank lenders was first provided at the start of 2016 and the figure has remained close to the initial value of 38,000.  From Q2 2016 we have been told the number of PDH accounts held by unregulated loan owners.

This started off at just over 10,000 and the number peaked at just over 12,200 at the end of 2016 and had fallen to 11,300 by the third quarter of 2017, with the total outstanding balance tracking moving from €1.9 billion to €2.4 billion to €2.2 billion over the same period. 

The reason for the recent decline is not provided and it could be, in part, a reclassification issue as the total number of loans (PDH plus BTL) held unregulated loan owners was largely unchanged over the period. The total was 18,200 in Q4 2016 and was 18,100 in Q3 2017. 

At the end of Q3 2017, the average balance on the PDH mortgage accounts held by unregulated loan owners was €190,000.  As it is possible for more than one account to be linked to the same PDH property it is likely that the 11,300 accounts corresponds to around 9,000 properties.

And here are the details of those accounts which are 720 days or more in arrears.

PDH Mortgage Accounts Arrears with Unregulated Loan Owners

Over 40 per cent of the PDH mortgage accounts held by unregulated loan owners are more than two years in arrears and these accounts make out almost 60 per cent of the total balance due on PDH mortgages to these entities.

The average balance on the accounts more than two years in arrears is over €250,000.  The figures giving the amount do not seem that reliable with a near 50 per cent jump showing for Q1 2017, so there is possibly some measurement or reclassification issue at play.  Taken at face value the Q3 2017 would indicate that the average amount of arrears on PDH mortgages which are more than two years in arrears held by unregulated loan owners was almost €130,000. 

That is an extreme level of arrears and seems incredible.  That would be six full years of missed payments on a 20-year €250,000 loan at an interest rate of six per cent.  There may be some instances of that but to suggest it is the average seems unlikely.

We don’t have much insight into the repossession activities for these entities.  In the Q1 2016 release it was shown that in that quarter between PDHs and BTLs unregulated loan owners and non-bank retail credit firms repossessed 15 properties on foot of a court order and took possession of a further 57 properties via a voluntary surrender arrangement.  Those made up about about five per cent of repossessions and 25 per cent of voluntary surrenders in the quarter.  However, without other observations it is difficult to make any meaning of those.

Repossession by Non-Bank Entities Q1 2016

In recent quarters a table like that above has not been provided and we have only been provided with the number of properties in possession of the entities at the end of the quarter rather than their repossession activity.  The number of PDH properties in the possession of unregulated loan owners at the end of the last three quarters were:

  • Q1 2017: 183
  • Q2 2017: 186
  • Q3 2017: 187

Without knowing the underlying repossessions and disposal amounts nothing can be gleaned from these figures.  It would be useful if the table provided in Q1 2016 was made available for PDH accounts held by unregulated loan owners which would show the level of court-ordered repossessions and voluntary surrenders involving these entities.  Getting some insight into the number of forced sales would also be useful and that applies to all mortgage providers not just unregulated loan owners.

What will happen to the loans held by unregulated loan owners?  It is still not clear but if proposed sales go ahead there is a good chance that they will increase.  After such sales are completed we can expect the numbers to decrease but how that will be achieved (redemptions, repossessions or resales) remains to be seen.

Monday, February 12, 2018

The national balance sheet

After looking at the improvements household sector financial balance sheet here we consider what is happening to the balance sheet for the entire economy.  Ireland has a bit to go until the presentation of our national balance sheet data reaches the level provided by the ONS for the UK but we can get a good idea of what is going on from the information that is available. 

The national balance sheet essentially comprises four items:

  • Non-produced fixed assets (such as land)
  • Produced fixed assets (such as buildings, infrastructure, equipment and IP)
  • Financial assets (such as deposits, equity and pension savings), and
  • Financial liabilities (such as loans)

For Ireland, the CSO provide figures for the latter three but estimates of the stock of non-produced assets are lacking and a broader measure of produced non-financial could be provided with the addition of estimates for inventories, and possibly, valuables.  There are very few countries providing these figures to Eurostat but their number is increasing. 

Still, what we have gives us a good start and there is a lot going on.  First a look at the broad categories since 2001.

National Balance Sheet 2001-2016 Table

Excluding land, for which figures for Ireland are not available, we can see that total net worth of the Irish economy was just over €240 billion at the end of 2001.  This rose to over €440 billion by around 2006/07 but this was based on inflated valuations and by 2011 net worth had fallen back to €180 billion.  It has recovered since then at stood at €315 billion at the end of 2016, or €66,600 per capita.

Behind this net worth figure the gross amounts are enormous, particularly on the financial side which is influenced by the investment funds linked to the IFSC.  These have huge gross positions but, by and large, the assets and liabilities net off against each other.  We can see this if we look at the net positions by sector.

Unfortunately, we are only give a breakdown of net financial worth by sector.  Ireland is one of seven countries that do not provide a breakdown of produced fixed assets by sector (the other six are Bulgaria, Cyprus, Malta, Romania, Slovakia and Spain).  This means we can’t get net worth (as defined here) by sector but we can track net financial worth by sector.  And it’s quite the roller-coaster.

National Balance Sheet by Sector 2001-2016 Table

By 2007, net financial worth of the total economy was a little less than minus €60 billion.  In the nine years since it has deteriorated by over €400 billion.  As we looked at earlier the net financial position of the household sector has been steadily improving and by the of 2016 was up more than €100 billion on its 2007 level.  Over the same period the net financial position of the government sector has deteriorated by €150 billion, with the net financial worth of non-financial corporations going south to the tune of €400 billion.  The position of financial corporations has bounced around a bit but has never gone outside the range +/- €50 billion.

The government doesn’t have a whole lot to show on the balance sheet for its borrowing as a lot of it went to fund current expenditure.  There has been a significant rise in produced fixed assets and it is easy to see that most of this has been bought by the NFC sector so the fixed assets will be matched by accompanying financial liabilities.  The household sector has been deleveraging and there has been very little output of the produced fixed asset it would buy: housing.

Anyway, even though the net financial position of the economy is down €400 billion since 2007, once we account for produced fixed assets that have been acquired we see that the net worth of the economy has gone from €440 billion in 2007 to €315 billion in 2016, a reduction of €125 billion.  Part of this fall and rise will have been due to house prices but it should be noted that the value of dwellings included in produced fixed-assets excludes the value of the land on which the property sits.

Here is what has happened to the nominal net values (i.e. after depreciation) of the main produced, non-financial assets. 

National Balance Sheet by Fixed Asset 2001-2016 Table

It can be seen that the nominal value of dwellings (excluding site value) fell by €85 billion in the years following 2007 and has recovered about half of that.  The value of other buildings is well ahead of 2007.  In the past two years the stock of fixed assets has surged by €300 billion with most of this due to changes in the suppressed categories dealing with aircraft for leasing and IP licenses.  As most of these are likely linked to financial liabilities they will net out in the overall net worth position.

There might be other items we would wish to see included particularly in relation to contingent or accrued liabilities.  At the sectoral level this might give a different view but in overall terms the net position of the economy would be unchanged as a liability for one sector would be an asset for another.  This would be the case, for example, is accrued pension liabilities to public sector workers were included.  They would be a liability for the government sector and an asset for the household sector.

So where stand us in relative terms compared to the rest of the EU15?

EU15 Total Net Worth Per Capita 1995-2016

Not great actually, but after the vertiginous drop in 2008 and flatlining from 2010 to 2014 we have been pulling away from the bottom of the pack for the past few years.  The volatility in the Irish series is not seen for any other country.

What would happen if land was included?  Here are the per capita net worths excluding and including land for the four countries which provide such estimates.

Net Worth without and with Land

Given the changes here it seems probable that Ireland’s per capita net worth would roughly double if the value of land was included, though the relative ranking in 2016 may not be much changed if this was applied across all countries.  Let’s hope we can rise through the rankings in a more sustainable fashion this time.

To conclude here are the main items on the balance sheet in per capita terms for Ireland since 2001.  Click to enlarge.  And note again these values are nominal.

Ireland National Balance Sheet per capita 2016 Table

And for the countries of the EU15 (excluding Luxembourg) for 2016.

National Balance Sheet per capita 2016 Table

Friday, February 9, 2018

Some snapshots of labour markets in the EU15

Here are some snapshots of conditions in the labour markets of the EU15.  They are offered without commentary.

  • Self employed with no paid employees
  • Temporary employees
  • Temporary agency workers
  • Shift workers
  • Underemployed part-time workers
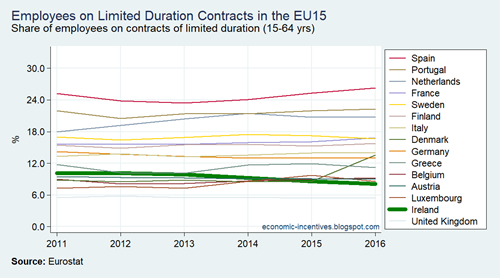
  • Contracts of limited duration
  • Precarious employment rate
  • Employed persons with a second job
  • People working 49 hours or more per week
  • Employees at-risk-of-poverty

EU15 LFS Self Employed with No Paid Employees

EU15 LFS Temporary Employees

EU15 LFS Temporary Agency Workers

EU15 LFS Shift Workers

EU15 LFS Part-time Underemployed

EU15 LFS Contracts of Limited Duration

EU15 LFS Precarious Employment Rate

EU15 LFS Second Job

EU15 LFS Long Working Hours

EU15 SILC Employees AROP 2009-2016

Printfriendly