There are a number of measures of government revenue and expenditure. The Exchequer Accounts tend to get a lot of attention as they are released on a monthly basis but they only give a partial picture of the government sector. The general government accounts give a far better overview of the impact of the government sector on the economy.
These are not produced on a regular basis but the requirements of the Stability and Growth Pact means a useful table is included in the Stability Programme Updates which are now published each April. The general government accounts are not perfect but they are far more useful than the Exchequer Accounts.
The general government sector includes central government, local government and the Social Insurance Fund. It does not include semi-state companies, state-owned banks or NAMA.
The ‘underlying’ general government balance, which is the overall balance net of temporary measures, is the benchmark used in the Excessive Deficit Procedure and it is this that must be reduced to under 3% of GDP by 2015. The following table gives the overall and underlying general government balances from 2006 to 2012, and by subtracting interest expenditure from the latter the underlying primary balance.

As a result of the effect of the bank-bailout payments, which form the bulk of the temporary measures that occurred between 2009 and 2011, it is difficult to determine what direction the public finances are going. The underlying deficit peaked at 12.2% of GDP in 2009, fell in the next two years and is projected to continue falling in 2012.
The primary deficit measures the excess over revenue that the government is spending on providing goods, services and transfers to Irish people. The underlying primary deficit also peaked in 2009 and when it hit 10.2% of GDP. Since then it has declined and it is expected to be 4.5% of GDP in 2012.
The improvement in the primary balance is greater because of the impact of our increased interest expenditure on the underlying balance. Interest expenditure was 4.1% of GDP in 2012. More than one-quarter of this was carried into the crisis and in excess of a half of it was due to the underlying deficits that ballooned in 2008 and 2009. Interest on the bank bailout forms a very small part of the 2012 interest expenditure.
The trend is clear. Since 2009, both the underlying balance and the underlying primary balance have been declining, though both still remain excessively high.
The following table gives the euro-equivalent of the GDP proportions in the above table.

The underlying balance has improved from €19.6 billion in 2009 to €13.7 billion in 2012. By applying the temporary measures (the largest of which are the bank-bailout payments) to total expenditure we can get a crude measure of ‘underlying expenditure.

The excess money we are spending on ourselves as measured by the underlying primary balance has fallen from €16.4 billion to 2009 to a projected €7.2 billion this year. In 2007 the general government ran a surplus of almost €2 billion. Of the deterioration of more than €18 billion that occurred over the following two years, one-third was due to the an increase in expenditure and two-thirds was due to a drop in revenue.
It can also be seen that interest expenditure is projected to be €6.5 billion this year and that it was almost €2 billion in the run-up to the crisis. Finally, we will look at the breakdown of revenue and expenditure provided in the general government accounts. Click to enlarge.

The reason for the drop in revenue can be easily noted in the main revenue columns of ‘taxes on production and imports’ and ‘current taxes on income and wealth’. After bottoming out in 2010 revenue has risen slightly in the past two years.
In the expenditure table the figures for compensation of employees and intermediate consumption were not provided separately until 2010. Since then the combined figures have been €27.7bn, €26.5bn, and €26.6bn. Cash transfers peaked at €25 billion in 2009 and are expected to be €24 billion this year.
The named column that shows the largest reduction is gross fixed capital formation or investment. Investment from the general government sector (central and local government) was almost €10 billion in 2008 but this has been cut to just €4 billion for 2012. It is the cuts in capital expenditure that have brought expenditure down.
Current expenditure has remained largely unchanged over the past five years. It is up about €1.5 billion since 2008 but the composition of the total has changed. There has been an increase of around €4.5 billion in interest expenditure since 2008 which has been partially offset by a €3 billion reduction in primary current expenditure.
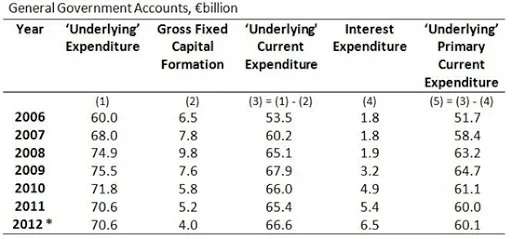
Looking at the gross expenditure figures can be slightly misleading and there are some important reasons why they should not be considered in isolation. One such caveat is the Public Sector Pension Levy which raises around €1 billion a year. When this was introduced government gross expenditure was unchanged and the impact of the “pay cut” was seen as an increase in revenue.
Even taking into account this it is still the clear that only a relatively small portion of the improvement in the public finances has taken place via current expenditure/revenue which is by far the largest area of expense. A greater amount of ‘improvement’ has come from the huge reductions in capital expenditure. In 2012, out of primary expenditure of €64 billion, just €4 billion or 6% will be on capital investment. Around 94% of expenditure will be current.


 Posts

